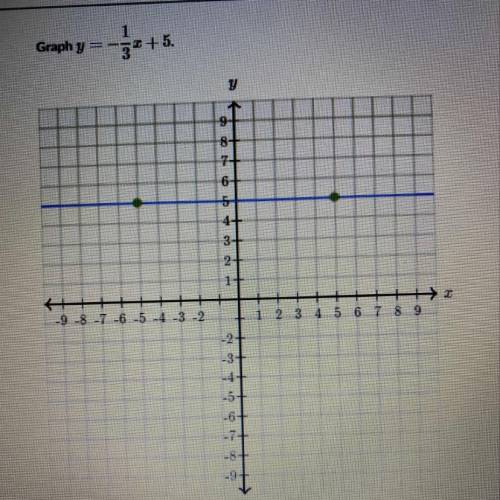
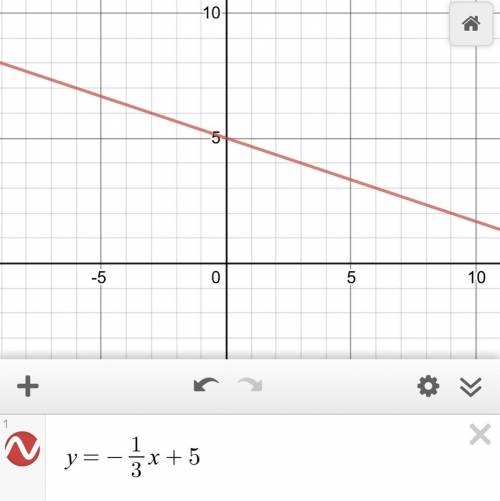
Graph y=-1/3x+5. Plsss help hurry
...

Answers: 3


Another question on Mathematics

Mathematics, 21.06.2019 17:00
What is the difference between the points (4, 7) and (4, -5)? a. 0 units b. 2 units c. 4 units d. 12 units
Answers: 1
Mathematics, 21.06.2019 21:30
Acompany charges $0.10 for each letter engraved. bobby plans to spend no more than $5.00 on the engraving on a jewelry box. write and solve an inequality to find the maximum number of letters he can have engraved.
Answers: 1
Mathematics, 21.06.2019 23:30
(c) compare the results of parts (a) and (b). in general, how do you think the mode, median, and mean are affected when each data value in a set is multiplied by the same constant? multiplying each data value by the same constant c results in the mode, median, and mean increasing by a factor of c. multiplying each data value by the same constant c results in the mode, median, and mean remaining the same. multiplying each data value by the same constant c results in the mode, median, and mean decreasing by a factor of c. there is no distinct pattern when each data value is multiplied by the same constant. (d) suppose you have information about average heights of a random sample of airline passengers. the mode is 65 inches, the median is 72 inches, and the mean is 65 inches. to convert the data into centimeters, multiply each data value by 2.54. what are the values of the mode, median, and mean in centimeters? (enter your answers to two decimal places.) mode cm median cm mean cm in this problem, we explore the effect on the mean, median, and mode of multiplying each data value by the same number. consider the following data set 7, 7, 8, 11, 15. (a) compute the mode, median, and mean. (enter your answers to one (1) decimal places.) mean value = median = mode = (b) multiply 3 to each of the data values. compute the mode, median, and mean. (enter your answers to one (1) decimal places.) mean value = median = mode = --
Answers: 1
Mathematics, 22.06.2019 01:00
The weight of 46 new patients of a clinic from the year 2018 are recorded and listed below. construct a frequency distribution, using 7 classes. then, draw a histogram, a frequency polygon, and an ogive for the data, using the relative information from the frequency table for each of the graphs. describe the shape of the histogram. data set: 130 192 145 97 100 122 210 132 107 95 210 128 193 208 118 196 130 178 187 240 90 126 98 194 115 212 110 225 187 133 220 218 110 104 201 120 183 124 261 270 108 160 203 210 191 180 1) complete the frequency distribution table below (add as many rows as needed): - class limits - class boundaries - midpoint - frequency - cumulative frequency 2) histogram 3) frequency polygon 4) ogive
Answers: 1
You know the right answer?
Questions

Physics, 06.03.2021 03:20


Advanced Placement (AP), 06.03.2021 03:20


World Languages, 06.03.2021 03:20


