
Mathematics, 20.08.2020 02:01 ChaseRussell24
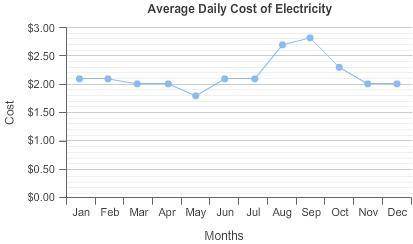
The line graph shows the average daily cost, rounded to the nearest 10 cents, that a homeowner paid for electricity each month of a year. In which month(s) was the average daily cost less than $2.00? May, September September only May only March, April, May

Answers: 1


Another question on Mathematics
Mathematics, 21.06.2019 17:30
The table shows the balance of a money market account over time. write a function that represents the balance y (in dollars) after t years.
Answers: 3
Mathematics, 21.06.2019 18:00
14. (05.02 lc) what is the value of y in the solution to the following system of equations? (5 points) 2x + y = −4 5x + 3y = −6
Answers: 1
You know the right answer?
The line graph shows the average daily cost, rounded to the nearest 10 cents, that a homeowner paid...
Questions
Mathematics, 12.03.2021 23:20
Mathematics, 12.03.2021 23:20
Mathematics, 12.03.2021 23:20
Mathematics, 12.03.2021 23:20
Mathematics, 12.03.2021 23:20
Mathematics, 12.03.2021 23:20

Computers and Technology, 12.03.2021 23:20

English, 12.03.2021 23:20
Mathematics, 12.03.2021 23:20

Social Studies, 12.03.2021 23:20
Social Studies, 12.03.2021 23:20
Social Studies, 12.03.2021 23:20

History, 12.03.2021 23:20

English, 12.03.2021 23:20


