
Mathematics, 20.08.2020 07:01 maevemboucher78
Thanks for the help :)
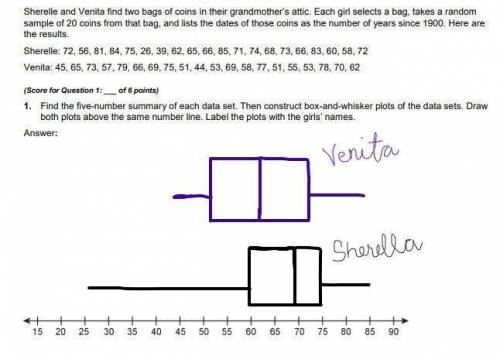
(a) Contrast the shapes of the data sets displayed in the box-and-whisker plots in Question 1. Explain what the difference in the shapes means in context of the situation.
(b) Compare the spread of the data sets. Discuss both the overall spread and the spread within the boxes.
(c) Use an appropriate measure of central tendency to compare the center of the data sets. Explain what the difference in those measures means in context of the situation.
(Graph to question 1 attached below)

Answers: 1


Another question on Mathematics
Mathematics, 21.06.2019 18:50
The number of fish in a lake can be modeled by the exponential regression equation y=14.08 x 2.08^x where x represents the year
Answers: 3
Mathematics, 21.06.2019 19:00
What is the volume of a cone with a height of 6 cm in the radius of 2 cm
Answers: 1
Mathematics, 21.06.2019 21:50
If you double the input of a function and it results in half the output, and if you triple the input and it results in a third of the output, what can be guessed about the function? check all that apply.
Answers: 3
You know the right answer?
Thanks for the help :)
(a) Contrast the shapes of the data sets displayed in the box-and-whisker pl...
Questions
Mathematics, 08.06.2020 16:57

World Languages, 08.06.2020 17:57
Mathematics, 08.06.2020 17:57
Mathematics, 08.06.2020 17:57


Biology, 08.06.2020 17:57
Biology, 08.06.2020 17:57

Physics, 08.06.2020 17:57


Chemistry, 08.06.2020 17:57
Mathematics, 08.06.2020 17:57
Mathematics, 08.06.2020 17:57
World Languages, 08.06.2020 17:57
Mathematics, 08.06.2020 17:57

English, 08.06.2020 17:57

Advanced Placement (AP), 08.06.2020 17:57


