
Mathematics, 21.08.2020 01:01 shookie1993
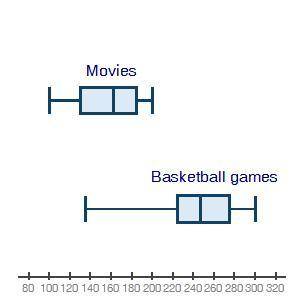
The box plots below show attendance at a local movie theater and high school basketball games:
Two box plots are shown. The top one is labeled Movies. Minimum at 100, Q1 at 130, median at 165, Q3 at 185, maximum at 200. The bottom box plot is labeled Basketball games. Minimum at 135, Q1 at 225, median at 248, Q3 at 275, maximum at 300.
Which of the following best describes how to measure the spread of the data?
A. The IQR is a better measure of spread for movies than it is for basketball games.
B. The standard deviation is a better measure of spread for movies than it is for basketball games.
C. The IQR is the best measurement of spread for games and movies.
D. The standard deviation is the best measurement of spread for games and movies.

Answers: 3


Another question on Mathematics
Mathematics, 21.06.2019 18:30
Acone with volume 1350 m³ is dilated by a scale factor of 1/3. what is the volume of the resulting cone? enter your answer in the box. m³
Answers: 1
Mathematics, 21.06.2019 20:30
Is the point (0, 8) on the x-axis or y-axis? how do you know?
Answers: 2
Mathematics, 21.06.2019 21:20
52 cm radius = diameter = area = circumference = circumfer
Answers: 1
You know the right answer?
The box plots below show attendance at a local movie theater and high school basketball games:
Two...
Questions

Mathematics, 22.10.2020 18:01
Mathematics, 22.10.2020 18:01
Mathematics, 22.10.2020 18:01
Mathematics, 22.10.2020 18:01
Mathematics, 22.10.2020 18:01


History, 22.10.2020 18:01

Mathematics, 22.10.2020 18:01
Mathematics, 22.10.2020 18:01

Arts, 22.10.2020 18:01


