
Mathematics, 25.08.2020 03:01 sheabenitez305
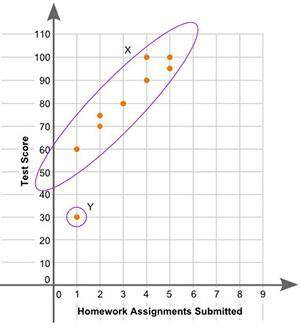
The scatter plot shows the relationship between the number of homework assignments turned in over a week and the test score for that same week: Part A: What is the group of points labeled X called? What is the point labeled Y called? Give a possible reason for the presence of point Y. Part B: Describe the association between a student’s test scores and the number of homework assignments submitted.

Answers: 1


Another question on Mathematics
Mathematics, 21.06.2019 18:00
Which shows the correct lengths of side c in both scales? scale 1: 45 m; scale 2: 60 m scale 1: 60 m; scale 2: 45 m scale 1: 36 m; scale 2: 27 m scale 1: 27 m; scale 2: 36 m mark this and return save and exit
Answers: 3
Mathematics, 21.06.2019 18:40
Which of the following represents the range of the graph of f(x) below
Answers: 1
Mathematics, 21.06.2019 19:30
Acylinder with a base diameter of x units has a volume of jxcubic units which statements about the cylinder are true? check all that apply. the radius of the cylinder is 2 x units. the radius of the cylinder is 2x units. the area of the cylinder's base is 200 square units. the area of the cylinder's base is a square units. the height of the cylinder is 2x units. the height of the cylinder is 4x units. mark this and return save and exit next submit
Answers: 2
You know the right answer?
The scatter plot shows the relationship between the number of homework assignments turned in over a...
Questions


English, 20.01.2022 21:20
Mathematics, 20.01.2022 21:20
Mathematics, 20.01.2022 21:20

Mathematics, 20.01.2022 21:20
Mathematics, 20.01.2022 21:30
Mathematics, 20.01.2022 21:30
Mathematics, 20.01.2022 21:30
Mathematics, 20.01.2022 21:30

History, 20.01.2022 21:30


