
Mathematics, 26.08.2020 06:01 hellomlatasha7134
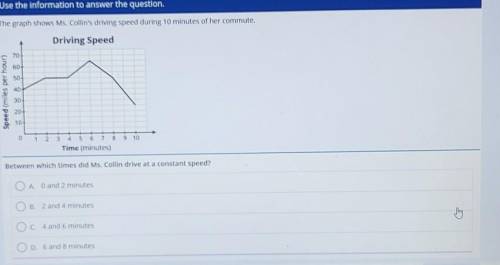
The graph shows Ms. Collin's driving speed during 10 minutes of her commute. Driving Speed 70 60+ 50 40 Speed (miles per hour) 30 20 10 0 1 2 9 10 3 4 5 6 7 8 Time (minutes) Between which times did Ms. Collin drive at a constant speed? A. O and 2 minutes B. 2 and 4 minutes O c. 4 and 6 minutes D. 6 and 8 minutes

Answers: 1


Another question on Mathematics
Mathematics, 21.06.2019 14:00
Ben bowled 124 and 188 in his first two games. what must he bowl in his third game to have an average of at least 160?
Answers: 1
Mathematics, 21.06.2019 22:10
Which of the following circles have their centers in the third quadrant?
Answers: 2
You know the right answer?
The graph shows Ms. Collin's driving speed during 10 minutes of her commute. Driving Speed 70 60+ 50...
Questions
Mathematics, 06.01.2021 17:00
Mathematics, 06.01.2021 17:00
Mathematics, 06.01.2021 17:00

History, 06.01.2021 17:00

History, 06.01.2021 17:00


Business, 06.01.2021 17:00

Advanced Placement (AP), 06.01.2021 17:00
Mathematics, 06.01.2021 17:00
Mathematics, 06.01.2021 17:00

Social Studies, 06.01.2021 17:00

World Languages, 06.01.2021 17:00
Mathematics, 06.01.2021 17:00
Mathematics, 06.01.2021 17:00


