
Mathematics, 27.08.2020 01:01 staciagirl3880
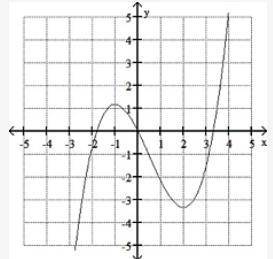
Use the graph of f to estimate the local maximum and local minimum. A cubic graph is shown increasing, then decreasing, then increasing again. The graph intercepts the x axis at approximately -1.8, 0, and 3.2. Local maximum: approx. (-1,1.17); local minimum: approx. (2,-3.33) Local maximum: (0,0); local minimum: (3.2,0) Local maximum: ∞ local minimum: -∞ No local maximum; no local minimum

Answers: 2


Another question on Mathematics
Mathematics, 22.06.2019 02:00
Sally deposited money into a savings account paying 4% simple interest per year. the first year, she earned $75 in interest. how much interest will she earn during the following year? show your work and explain your reasoning in the space provided below.
Answers: 2
Mathematics, 22.06.2019 11:00
Using the transformation t: (x, y) (x + 2, y + 1), find the distance named. find the distance cc'
Answers: 1
You know the right answer?
Use the graph of f to estimate the local maximum and local minimum. A cubic graph is shown increasin...
Questions


Mathematics, 18.06.2021 18:40
Mathematics, 18.06.2021 18:40
Engineering, 18.06.2021 18:40


Advanced Placement (AP), 18.06.2021 18:40
Mathematics, 18.06.2021 18:40


