
Mathematics, 01.09.2020 21:01 Queenbabybunnyboo
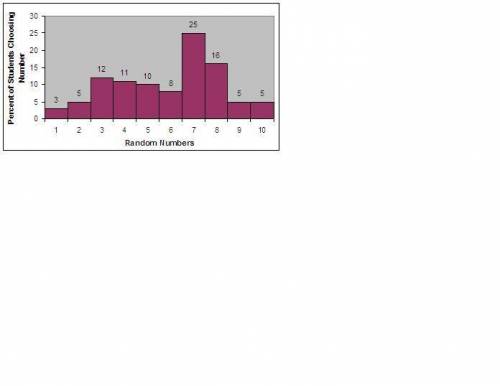
Each student in a statistics class was asked to randomly select a number from 1 to 10. The graph below summarizes their choices. The height of the bar above a number indicates the percentage of students in the class that chose that number (the actual percentage is shown above each bar). Question 1. What is the first quartile Q1 of all the numbers selected by the students? What is the third quartile Q3 of all the numbers selected by the students?

Answers: 2


Another question on Mathematics
Mathematics, 21.06.2019 16:50
The rate of decay of a radioactive substance depends upon the amount present initially. the mass y (mg) of the radioactive substance cobalt-60 present in a sample at time t (years) is represented by the exponential equation y=50e −0.1315 t . answer the following questions in complete sentences. 1. how does the exponential equation above compare to the equation for simple interest that is compounded continuously? explain the similarities. 2. what is the initial amount of cobalt-60 in the sample? 2. how much cobalt-60 is left after 8.4 years? show your work. 3. what would be the y-intercept of the graph? what does it represent? 4. after how many years will the amount of cobalt-60 left be 6.25 mg? explain what happens to the cobalt-60 after 50 years? 5. discuss some “real-world” examples and uses of cobalt-60
Answers: 1
Mathematics, 21.06.2019 18:30
Isuck at math ; ^; m a student solved this problem and said the answer is 3 feet. chase had a roll of ribbon that contained 7 7/8 feet of ribbon. he cut off one piece that was 3 5/8 feet long and another piece that was 1 1/4 feet from the roll. how much ribbon was left on the roll? is the student's answer reasonable? yes, the answer is reasonable. no, the answer is not reasonable. it should be about 2 feet. no, the answer is not reasonable. it should be about 13 feet. no, the answer is not reasonable. it should be about 4 feet.
Answers: 1
Mathematics, 21.06.2019 23:40
The frequency table shows the results of a survey asking people how many hours they spend online per week. on a piece of paper, draw a histogram to represent the data. then determine which answer choice matches the histogram you drew. in order here is the.. hours online: 0-3, 4-7, 8-11, 12-15, and 16-19. frequency: 5, 8, 10, 8, 7 answer for the question is in the picture! : )
Answers: 2
You know the right answer?
Each student in a statistics class was asked to randomly select a number from 1 to 10. The graph bel...
Questions

Computers and Technology, 07.08.2019 23:30
Computers and Technology, 07.08.2019 23:30


Mathematics, 07.08.2019 23:30
English, 07.08.2019 23:30

Biology, 07.08.2019 23:30

Computers and Technology, 07.08.2019 23:30
Computers and Technology, 07.08.2019 23:30
Computers and Technology, 07.08.2019 23:30


