
Mathematics, 01.09.2020 20:01 mathnation1
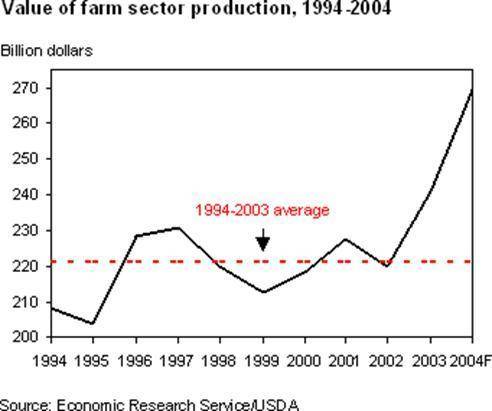
The following graph shows farm sector production in billions of dollars from 1994–2003. One line shows the yearly production and the other shows the average over the time span. According to the graph, in which 3 years were the values of farm sector production closest to the average for the 10 years shown?
A): 1994, 1996, 1998
B): 1996, 1998, 2000
C): 1998, 2000, 2002
D): 2000, 2002, 2004

Answers: 2


Another question on Mathematics
Mathematics, 21.06.2019 16:30
Its due ! write an equation in which the quadratic expression 2x^2-2x 12 equals 0. show the expression in factored form and explain what your solutions mean for the equation. show your work.
Answers: 1
Mathematics, 21.06.2019 16:30
Acircle has a circumference of 2 pi cm. which statement about the circumference and area is true? a comparison of the area and circumference is not possible since the area cannot be determined. the numerical values of the circumference and area of the circle are equal. the numerical value of the circumference is greater than the numerical value of the area. the numerical value of the circumference is less than the numerical value of the area.
Answers: 3
Mathematics, 21.06.2019 20:00
You wanted to draw an enlargement of design that printed on a card that is 4 in by 5
Answers: 1
Mathematics, 21.06.2019 20:30
Elizabeth claims that the fourth root of 2 can be expressed as 2^m since (2^m)^n = 2. find the values of m and n for the case where elizabeth's claim is true.
Answers: 3
You know the right answer?
The following graph shows farm sector production in billions of dollars from 1994–2003. One line sho...
Questions

World Languages, 07.10.2019 04:30

Social Studies, 07.10.2019 04:30


Physics, 07.10.2019 04:30

Computers and Technology, 07.10.2019 04:30
Physics, 07.10.2019 04:30

English, 07.10.2019 04:30

Mathematics, 07.10.2019 04:30
Physics, 07.10.2019 04:30

Chemistry, 07.10.2019 04:30
Mathematics, 07.10.2019 04:30
Mathematics, 07.10.2019 04:30

Arts, 07.10.2019 04:30
History, 07.10.2019 04:30


