
Mathematics, 05.09.2020 04:01 silasjob09
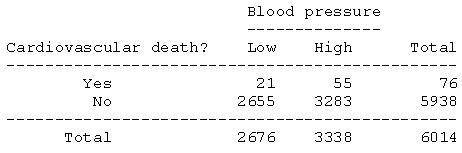
1)High blood pressure is unhealthy. Here are the results of one of the studies that link high blood pressure to death from cardiovascular disease. The researchers classified a group of white males aged 35 to 64 as having low blood pressure or high blood pressure, then followed the subjects for 5 years. The following two-way table gives the results of the study: In this example, which of the following would be appropriate to calculate? A)Conditional row percentages B)Conditional column percentages C)The correlation coefficient r d)The five-number summary of both variables 2)

Answers: 2


Another question on Mathematics
Mathematics, 21.06.2019 13:30
What number produces an irrational number when multiplied by -1.25
Answers: 2
Mathematics, 21.06.2019 17:30
James adds two numbers a + b. sally adds the same two numbers but reverse the order b + a what property of addition assures us that james and sally will get the same sum
Answers: 2
Mathematics, 21.06.2019 21:30
Name and describe the three most important measures of central tendency. choose the correct answer below. a. the mean, sample size, and mode are the most important measures of central tendency. the mean of a data set is the sum of the observations divided by the middle value in its ordered list. the sample size of a data set is the number of observations. the mode of a data set is its highest value in its ordered list. b. the sample size, median, and mode are the most important measures of central tendency. the sample size of a data set is the difference between the highest value and lowest value in its ordered list. the median of a data set is its most frequently occurring value. the mode of a data set is sum of the observations divided by the number of observations. c. the mean, median, and mode are the most important measures of central tendency. the mean of a data set is the product of the observations divided by the number of observations. the median of a data set is the lowest value in its ordered list. the mode of a data set is its least frequently occurring value. d. the mean, median, and mode are the most important measures of central tendency. the mean of a data set is its arithmetic average. the median of a data set is the middle value in its ordered list. the mode of a data set is its most frequently occurring value.
Answers: 3
Mathematics, 21.06.2019 22:00
The evening newspaper is delivered at a random time between 5: 30 and 6: 30 pm. dinner is at a random time between 6: 00 and 7: 00 pm. each spinner is spun 30 times and the newspaper arrived 19 times before dinner. determine the experimental probability of the newspaper arriving before dinner.
Answers: 1
You know the right answer?
1)High blood pressure is unhealthy. Here are the results of one of the studies that link high blood...
Questions

History, 07.12.2019 01:31

Social Studies, 07.12.2019 01:31

Geography, 07.12.2019 01:31
Mathematics, 07.12.2019 01:31
History, 07.12.2019 01:31
Geography, 07.12.2019 01:31


Biology, 07.12.2019 01:31
Mathematics, 07.12.2019 01:31

Chemistry, 07.12.2019 01:31


