
Mathematics, 07.09.2020 01:01 devaughnnorthcu1565
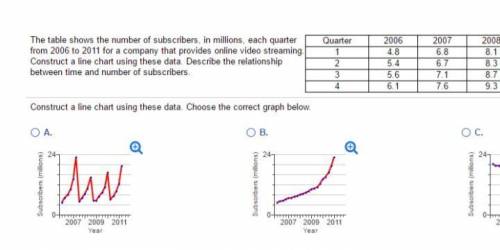
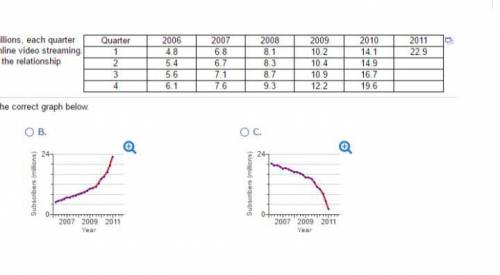
The table shows the number of world-wide subscribers, in millions, each quarter from 2012 to 2017 for a company that provides online video streaming. Construct a line chart using these data. Describe the relationship between time and number of subscribers.
Quarter 2006 2007 2008 2009 2010 2011
1 4.8 6.8 8.1 10.2 14.1 22.9
2 5.4 6.7 8.3 10.4 14.9
3 5.6 7.1 8.7 10.9 16.7
4 6.1 7.6 9.3 12.2 19.6
Required:
Construct a line chart using these data.

Answers: 1


Another question on Mathematics
Mathematics, 21.06.2019 12:30
Regular price is $77.00 and the discount is 5% find the sale price
Answers: 3
Mathematics, 21.06.2019 13:10
Two different linear functions are shown below with two points given from each function. use slope-intercept form or point-slope form to find the equation of each. linear function a points: (–5, –2), (–5, 7) linear function b points: (7, –5), (–2, –5) function a has: the equation of line a is: function b has: the equation of line b is:
Answers: 1
Mathematics, 21.06.2019 20:40
Lines a and b are parallel. what is the value of x? -5 -10 -35 -55
Answers: 2
Mathematics, 21.06.2019 21:50
Aline passes through the point (–7, 5) and has a slope of 1/2 which is another point that the line passes through?
Answers: 3
You know the right answer?
The table shows the number of world-wide subscribers, in millions, each quarter from 2012 to 2017 fo...
Questions

English, 26.08.2020 23:01


Advanced Placement (AP), 26.08.2020 23:01
Mathematics, 26.08.2020 23:01

Mathematics, 26.08.2020 23:01


Mathematics, 26.08.2020 23:01

Mathematics, 26.08.2020 23:01
Mathematics, 26.08.2020 23:01
English, 26.08.2020 23:01
Mathematics, 26.08.2020 23:01
Mathematics, 26.08.2020 23:01
Mathematics, 26.08.2020 23:01
Business, 26.08.2020 23:01


