
Mathematics, 07.09.2020 02:01 hiitslillyhere
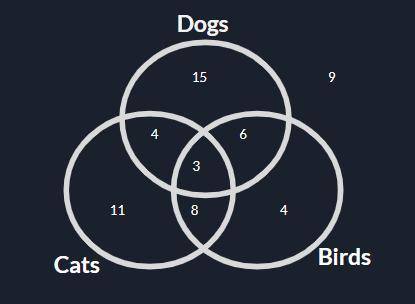
The Venn Diagram above shows the result of the students taking a poll about what animals they owned. What is the probability that a randomly selected student have both birds and dogs? (select all that apply) 9/51 0.176 2/3 0.667 3/20 0.15 2. The Venn Diagram above shows the result of the students taking a poll about what animals they owned. What is the probability that a randomly selected student has a cat or a dog? 0.92 0.5 0.43 0.78

Answers: 1


Another question on Mathematics
Mathematics, 21.06.2019 21:00
What is the unit rate of, 75% high fiber chimp food to 25% high protein chimp food.
Answers: 1
Mathematics, 22.06.2019 02:30
Aliter of water contains about 3.35 x 10^25 molecules. a certain river discharges about 2.9x 10^8 l of water every second. about how many molecules does the river discharge every minute? write your answer in scientific notation
Answers: 1
Mathematics, 22.06.2019 03:10
The coverage of a base station of a telecommunication company forms a disk with a radius of (kilometers). let be the distance of a cellphone from a base station. assume that the location of cellphones in use are randomly uniformly distributed within the disk. calculate the mean and variance for the random variable.
Answers: 3
You know the right answer?
The Venn Diagram above shows the result of the students taking a poll about what animals they owned....
Questions
Mathematics, 21.06.2021 14:00
Mathematics, 21.06.2021 14:00
Mathematics, 21.06.2021 14:00
Mathematics, 21.06.2021 14:00

Mathematics, 21.06.2021 14:00
Mathematics, 21.06.2021 14:00
Mathematics, 21.06.2021 14:00
Mathematics, 21.06.2021 14:00


History, 21.06.2021 14:00
English, 21.06.2021 14:00

Chemistry, 21.06.2021 14:00
Mathematics, 21.06.2021 14:00
Mathematics, 21.06.2021 14:00
Mathematics, 21.06.2021 14:00
History, 21.06.2021 14:00
History, 21.06.2021 14:00


