
Mathematics, 19.09.2020 01:01 journeyhile5
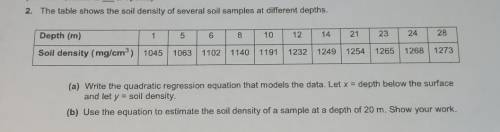
2. The table shows the soil density of several soil samples at different depths. Depth (m) 1 5 6 8 10 12 14 21 23 24 28 Soil density (mg/cm) 1045 1063 1102 1140 1191 1232 1249 1254 1265 1268 1273 (a) Write the quadratic regression equation that models the data. Let x = depth below the surface and let y = soil density. (b) Use the equation to estimate the soil density of a sample at a depth of 20 m. Show your work.

Answers: 1


Another question on Mathematics
Mathematics, 21.06.2019 22:10
If p(a) = 0.70 and p(b) = 0.20, then a and b are independent events if
Answers: 3
Mathematics, 21.06.2019 23:30
Robin spent 25% more time on his research project than he had planned he’s been an extra h ours on the project which of the following expressions could represent the number of hours rob actually spent on the project
Answers: 3
Mathematics, 22.06.2019 02:00
Keith runs 5 miles in 38 minutes. at the same rate, how many miles would he run in 57 minutes
Answers: 1
You know the right answer?
2. The table shows the soil density of several soil samples at different depths. Depth (m) 1 5 6 8 1...
Questions
Mathematics, 29.05.2021 01:00
Mathematics, 29.05.2021 01:00


Mathematics, 29.05.2021 01:00


Mathematics, 29.05.2021 01:00
Mathematics, 29.05.2021 01:00
Mathematics, 29.05.2021 01:00
Mathematics, 29.05.2021 01:00
Mathematics, 29.05.2021 01:00


