
Mathematics, 19.09.2020 01:01 ImmortalEnigmaYT
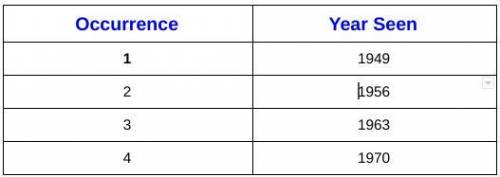
Lesson 1-1: The periodic comet named Johnson has been seen at every return since its discovery in 1949, as shown in the table below: Occurrence Year Seen 1- 1949 2 1956 3 1963 4 1970 Use the table for Items 1-5. Describe any pattern you see in the table. Write the values in the second column at the table as a sequence. Identify the common difference. If the pattern continues, in which of the following years will the comet be visible again? A. 2017 B. 2018 C. 2019 D. 2020 About how many times would the Johnson comet be visible during a typical person’s lifetime? Explain your reasoning. 5. Reason abstractly. A man was born during a year in which the Johnson comet was visible in the sky. The next time that the comet was visible after the man’s birth year was in 2005. In what year was the man born? The table to use is attached to the question.

Answers: 2
 times
times

Another question on Mathematics
Mathematics, 21.06.2019 17:00
Aplane flies around trip to philadelphia it flies to philadelphia at 220 miles per hour and back home with a tailwind at 280 miles per hour if the total trip takes 6.5 hours how many miles does the plane fly round trip
Answers: 1
Mathematics, 22.06.2019 03:00
Describe how the presence of possible outliers might be identified on the following. (a) histograms gap between the first bar and the rest of bars or between the last bar and the rest of bars large group of bars to the left or right of a gap higher center bar than surrounding bars gap around the center of the histogram higher far left or right bar than surrounding bars (b) dotplots large gap around the center of the data large gap between data on the far left side or the far right side and the rest of the data large groups of data to the left or right of a gap large group of data in the center of the dotplot large group of data on the left or right of the dotplot (c) stem-and-leaf displays several empty stems in the center of the stem-and-leaf display large group of data in stems on one of the far sides of the stem-and-leaf display large group of data near a gap several empty stems after stem including the lowest values or before stem including the highest values large group of data in the center stems (d) box-and-whisker plots data within the fences placed at q1 â’ 1.5(iqr) and at q3 + 1.5(iqr) data beyond the fences placed at q1 â’ 2(iqr) and at q3 + 2(iqr) data within the fences placed at q1 â’ 2(iqr) and at q3 + 2(iqr) data beyond the fences placed at q1 â’ 1.5(iqr) and at q3 + 1.5(iqr) data beyond the fences placed at q1 â’ 1(iqr) and at q3 + 1(iqr)
Answers: 1
Mathematics, 22.06.2019 03:30
Captain umaima has a ship, the h.m.s. khan. the ship is two furlongs from the dread pirate nadia and her merciless band of thieves. the captain has probability 3/7 of hitting the pirate ship. the pirate only has one good eye, so she hits the captain's ship with probability 2/5. if both fire their cannons at the same time, what is the probability that the captain hits the pirate ship, but the pirate misses.
Answers: 3
Mathematics, 22.06.2019 04:20
What percent of the butterfly tents contain at most 10 cocoons
Answers: 2
You know the right answer?
Lesson 1-1: The periodic comet named Johnson has been seen at every return since its discovery in 19...
Questions

Spanish, 05.07.2019 00:30
Spanish, 05.07.2019 00:30
Mathematics, 05.07.2019 00:30
Mathematics, 05.07.2019 00:30

History, 05.07.2019 00:30


English, 05.07.2019 00:30

Biology, 05.07.2019 00:30
History, 05.07.2019 00:30

Arts, 05.07.2019 00:30


