
Mathematics, 20.09.2020 03:01 paulonyemakonor549
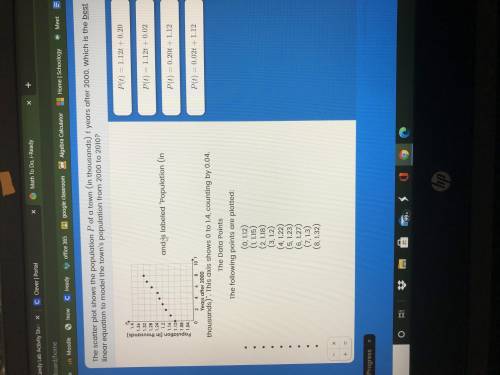
ASAP The scatter plot shows the population P of a town ( in thousands ) t years after 2000. Which is the best linear equation to model the towns population from 2000 to 2010?

Answers: 2


Another question on Mathematics
Mathematics, 21.06.2019 14:40
Which system of linear inequalities is represented by the graph? !
Answers: 1
Mathematics, 21.06.2019 18:20
Alana has 12.5 cups of flour with which she is baking four loaves of raisin bread and one large pretzel. the pretzel requires 2.5 cups of flour to make. how much flour is in each loaf of raisin bread? explain the steps to follow to get the answer.
Answers: 3
You know the right answer?
ASAP The scatter plot shows the population P of a town ( in thousands ) t years after 2000. Which is...
Questions


Social Studies, 20.09.2020 04:01
Mathematics, 20.09.2020 04:01


Biology, 20.09.2020 04:01
Mathematics, 20.09.2020 04:01


Mathematics, 20.09.2020 04:01

Arts, 20.09.2020 04:01


