
Mathematics, 20.09.2020 04:01 jungcoochie101
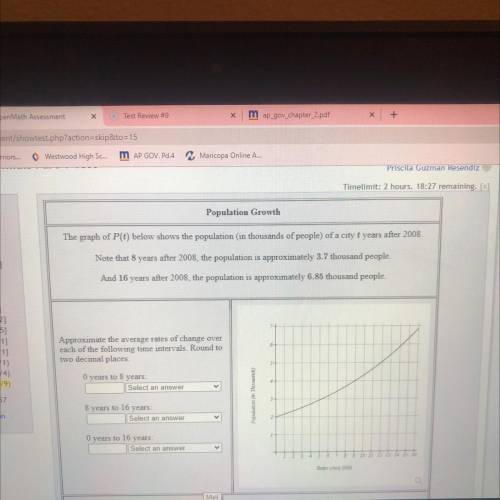
The graph of P(t) below shows the population in thousands of people) of a city t years after 2008
Note that 8 years after 2008, the population is approximately 3.7 thousand people.
And 16 years after 2008, the population is approximately 6.85 thousand people.
Approximate the average rates of change over
each of the following time intervals. Round to
two decimal places
6
0 years to 8 years:
Select an answer
Population ( 7 )
8 years to 16 years:
Select an answer
O years to 16 years:
Select an answer
13 14 15 16
Years since 2003

Answers: 1


Another question on Mathematics
Mathematics, 21.06.2019 19:30
Agroup of randomly selected apple valley high school students were asked to pick their favorite gym class. the table below shows the results of the survey. there are 528 students at apple valley high school. gym class number of students racquet sports 1 team sports 9 track and field 17 bowling 13 based on the data, what is the most reasonable estimate for the number of students at apple valley high school whose favorite gym class is bowling? choose 1 answer a. 9 b. 13 c. 119 d. 172
Answers: 1
Mathematics, 21.06.2019 22:00
The serenity and the mystic are sail boats. the serenity and the mystic start at the same point and travel away from each other in opposite directions. the serenity travels at 16 mph and the mystic travels at 19 mph. how far apart will they be in 3 hours?
Answers: 1
Mathematics, 22.06.2019 01:00
On friday, there were x students at the baseball game. on monday, there were half as many students at the game as there were on friday. on wednesday, there were 32 fewer students at the game as there were on friday. which expression could represent the total number of tickets sold for all 3 games?
Answers: 2
Mathematics, 22.06.2019 04:30
At the start of 2014 lucys house was worth ? 200 000. the value of the house increased by 5% every year. workout the value of her house at the start of 2017
Answers: 3
You know the right answer?
The graph of P(t) below shows the population in thousands of people) of a city t years after 2008...
Questions


Social Studies, 04.03.2021 14:00
Mathematics, 04.03.2021 14:00

Chemistry, 04.03.2021 14:00
Mathematics, 04.03.2021 14:00
Chemistry, 04.03.2021 14:00
Mathematics, 04.03.2021 14:00
Social Studies, 04.03.2021 14:00
Mathematics, 04.03.2021 14:00

Health, 04.03.2021 14:00
Mathematics, 04.03.2021 14:00

English, 04.03.2021 14:00
Chemistry, 04.03.2021 14:00
Mathematics, 04.03.2021 14:00
Chemistry, 04.03.2021 14:00


