
Mathematics, 20.09.2020 09:01 baidentheodore9750
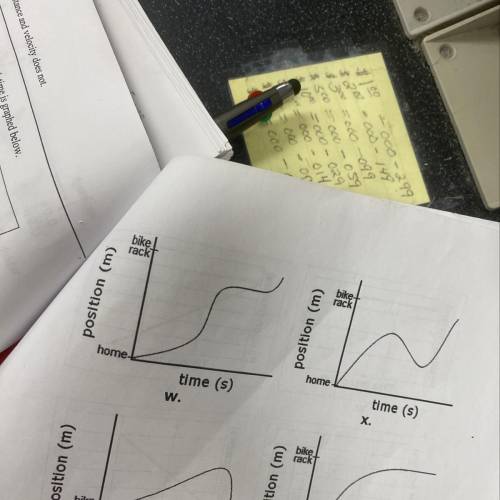
8. Aaron was riding his bicycle to school at a rate of 18 miles an hour down the street. As he got
closer to school, he gradually slowed his bike until he stopped at the bike rack.
Which of the graphs below best represents the change in Aaron's position over time?

Answers: 1


Another question on Mathematics
Mathematics, 21.06.2019 22:30
Question 3(multiple choice worth 1 points) use the arc length formula and the given information to find r. s = 16 cm, θ = 48°; r = ? sixty divided by pi cm thirty divided by pi cm one third cm one hundred twenty divided by pi cm
Answers: 1
Mathematics, 22.06.2019 00:00
Apassenger train and a freight train leave san jose at 3pm, traveling in the same direction. the passenger train is going three times as fast as the freight train. at 6pm they are 240 miles apart. how fast is each travelling? explain your answer and show your
Answers: 1
You know the right answer?
8. Aaron was riding his bicycle to school at a rate of 18 miles an hour down the street. As he got...
Questions


English, 23.06.2021 04:00

Business, 23.06.2021 04:00

Mathematics, 23.06.2021 04:00

Mathematics, 23.06.2021 04:00
Chemistry, 23.06.2021 04:00


