
Mathematics, 20.09.2020 09:01 ineedhelp2285
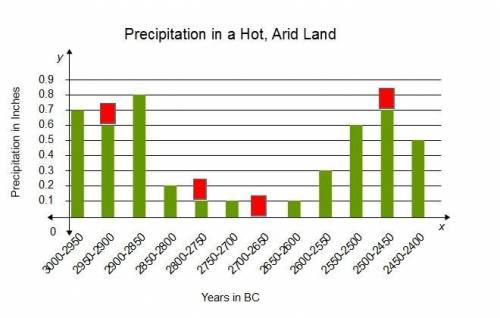
The bar diagram shows average rainfall for periods of 50 years. Study the bar diagram and identify the two periods in which a civilization would most likely collapse.

Answers: 2


Another question on Mathematics
Mathematics, 21.06.2019 12:30
Asilkworm winds its cocoon out of one long silk fiber. to make silk thread, 3 to 10 of these silk fibers are unwound from their cocoons and combined into aa single thread with a typical length of 300 yards. choose a reasonable number of silk fibers in a thread write an equation to find the total length of the silk fibersused in 300 yards of the thread
Answers: 3
Mathematics, 21.06.2019 14:00
Ben bowled 124 and 188 in his first two games. what must he bowl in his third game to have an average of at least 160?
Answers: 1
Mathematics, 21.06.2019 16:40
Which recursive formula can be used to determine the total amount of money earned in any year based on the amount earned in the previous year? f(n+1)=f(n)+5
Answers: 1
Mathematics, 21.06.2019 21:10
What is the domain of the given function? {(3,-2), (6, 1), (-1, 4), (5,9), (-4, 0); o {x | x= -4,-1, 3, 5, 6} o {yl y = -2,0, 1,4,9} o {x|x = -4,-2, -1,0, 1, 3, 4, 5, 6, 9} o y y = 4,-2, -1, 0, 1, 3, 4, 5, 6, 9}
Answers: 1
You know the right answer?
The bar diagram shows average rainfall for periods of 50 years. Study the bar diagram and identify t...
Questions

History, 29.09.2019 10:20
History, 29.09.2019 10:20


Chemistry, 29.09.2019 10:20

Biology, 29.09.2019 10:20
History, 29.09.2019 10:20

Business, 29.09.2019 10:20

Spanish, 29.09.2019 10:20
English, 29.09.2019 10:20

Health, 29.09.2019 10:20

Geography, 29.09.2019 10:20


