
Mathematics, 21.09.2020 14:01 vickiw
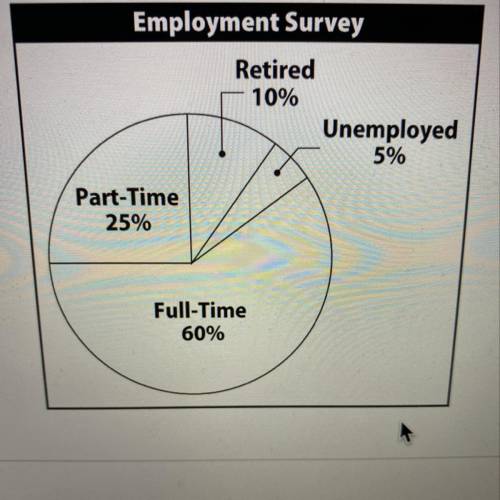
The circle graph shows the results of an employment survey of 800 people. How
many of the people surveyed were unemployed?
Employment Survey
Retired
10%
Unemployed
5%
Part-Time
25%
Full-Time
60%
A.40
B.120
C.20
D.80

Answers: 3


Another question on Mathematics
Mathematics, 21.06.2019 22:00
The figure shows the front side of a metal desk in the shape of a trapezoid. what is the area of this trapezoid? 10 ft²16 ft²32 ft²61 ft²
Answers: 2
Mathematics, 21.06.2019 22:00
Select the conic section that represents the equation. 3x2 + 3y2 -2x + 4 = 0
Answers: 2
Mathematics, 21.06.2019 23:00
What is the location of point g, which partitions the directed line segment from d to f into a 5: 4 ratio? –1 0 2 3
Answers: 1
You know the right answer?
The circle graph shows the results of an employment survey of 800 people. How
many of the people su...
Questions

English, 03.12.2019 06:31

History, 03.12.2019 06:31
Mathematics, 03.12.2019 06:31

History, 03.12.2019 06:31
History, 03.12.2019 06:31
Mathematics, 03.12.2019 06:31

Mathematics, 03.12.2019 06:31
History, 03.12.2019 06:31
History, 03.12.2019 06:31
Mathematics, 03.12.2019 06:31
Mathematics, 03.12.2019 06:31


