Mathematics, 25.09.2020 03:01 orozcoalbeert
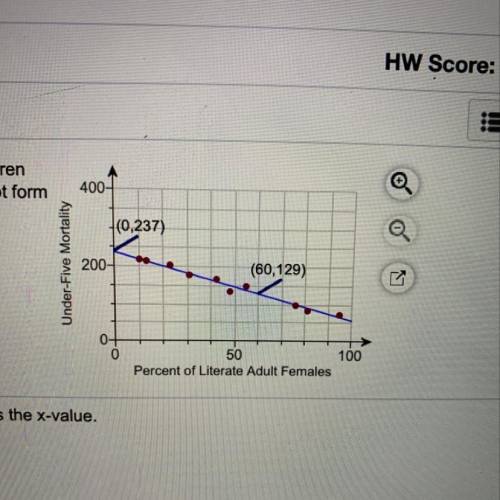
Shown to the right is a scatter plot that indicates a relationship between the percentage of adult females in a country who are literate and the mortality of children
under five (per thousand). Also shown is a line that passes through or near the points. Find a linear function that models the data by finding the slope-intercept form
of the line's equation. Use the function to make a prediction about child mortality based on the percentage of adult females in a country who are literate.


Answers: 2


Another question on Mathematics

Mathematics, 21.06.2019 17:30
If the class was going to get a class pet and 5 picked fish and 7 pick bird and 8 picked rabbits have many students were in the
Answers: 1

Mathematics, 21.06.2019 21:30
Find the unit rate for: 75% high-fiber chimp food to 25% high -protein chimp food.
Answers: 2

Mathematics, 21.06.2019 21:50
What function has a range {yly< 5}? question on picture above^
Answers: 3

Mathematics, 21.06.2019 22:30
Agroup of randomly selected members of the foodies food club were asked to pick their favorite type of food. the bar graph below shows the results of the survey. there are 244 members in the foodies.
Answers: 3
You know the right answer?
Shown to the right is a scatter plot that indicates a relationship between the percentage of adult f...
Questions


Mathematics, 08.12.2020 01:00

Mathematics, 08.12.2020 01:00


English, 08.12.2020 01:00


Mathematics, 08.12.2020 01:00

History, 08.12.2020 01:00


Social Studies, 08.12.2020 01:00

History, 08.12.2020 01:00


Mathematics, 08.12.2020 01:00


