
Mathematics, 25.09.2020 08:01 agyinbriana
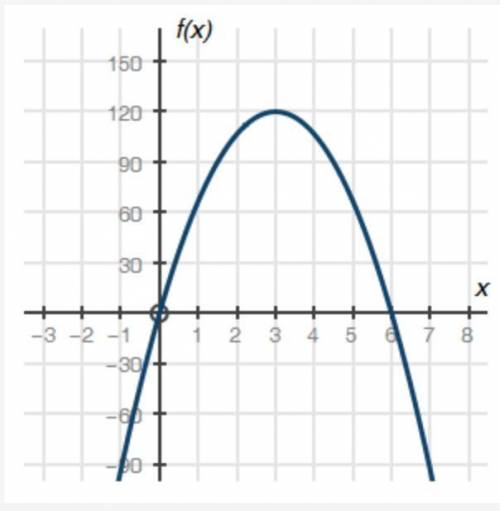
The graph below shows a company's profit f(x), in dollars, depending on the price of pens x, in dollars, sold by the company:
Part A: What do the x-intercepts and maximum value of the graph represent? What are the intervals where the function is increasing and decreasing, and what do they represent about the sale and profit? (4 points)
Part B: What is an approximate average rate of change of the graph from x = 3 to x = 5, and what does this rate represent? (3 points)
Part C: Describe the constraints of the domain. (3 points)

Answers: 1


Another question on Mathematics
Mathematics, 21.06.2019 14:30
Which of the following lines is parallel to x=4? a- 3y=9 b- y=4 c- x=2 d- x=y answer this as soon as possible xoxo lo ; )
Answers: 3
Mathematics, 21.06.2019 18:10
Points a, b, and c form a triangle. complete the statements to prove that the sum of the interior angles of triangle abc is 180
Answers: 1
Mathematics, 21.06.2019 20:30
If you are dealt 4 cards from a shuffled deck of 52? cards, find the probability that all 4 cards are diamondsdiamonds.
Answers: 1
Mathematics, 22.06.2019 01:30
Fill in the missing exponents in each box and show how you found the answer. (4 points: 2 points for each correct answer with work shown) c. (9^4)^? =9^1 d.(5^? )^3=5^1 *question marks represent the boxes
Answers: 3
You know the right answer?
The graph below shows a company's profit f(x), in dollars, depending on the price of pens x, in doll...
Questions


History, 25.09.2019 12:00

World Languages, 25.09.2019 12:00
Mathematics, 25.09.2019 12:00

Health, 25.09.2019 12:00

Mathematics, 25.09.2019 12:00
Biology, 25.09.2019 12:00

Mathematics, 25.09.2019 12:00
Health, 25.09.2019 12:00

English, 25.09.2019 12:00
Biology, 25.09.2019 12:00
Mathematics, 25.09.2019 12:00
English, 25.09.2019 12:00

Physics, 25.09.2019 12:00
Mathematics, 25.09.2019 12:00


