
Mathematics, 27.09.2020 22:01 Theyfall4raven
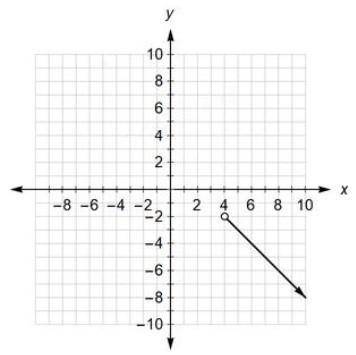
3. The graph of part of linear function h is shown on the grid.
(a) Write an inequality to represent the domain of the part shown. Explain your answer.
(b) Write an inequality to represent the range of the part shown. Explain your answer.

Answers: 3


Another question on Mathematics
Mathematics, 21.06.2019 12:30
(note i put the graph in so plz )the graph shows the amount of water that remains in a barrel after it begins to leak. the variable x represents the number of days that have passed since the barrel was filled, and y represents the number of gallons of water that remain in the barrel. what is the slope of the line
Answers: 1
Mathematics, 21.06.2019 13:50
Asimple random sample of size nequals14 is drawn from a population that is normally distributed. the sample mean is found to be x overbar equals 70 and the sample standard deviation is found to be sequals13. construct a 90% confidence interval about the population mean
Answers: 2
Mathematics, 21.06.2019 20:30
Explain how you divide powers with like bases.discuss why the bases have to be the same.how are these rules similar to the rules for multiplying powers with like bases.
Answers: 1
Mathematics, 21.06.2019 22:00
The coordinates r(1, -3), s(3, -1) t(5, -7) form what type of polygon? a right triangle an acute triangle an equilateral triangle an obtuse triangle
Answers: 1
You know the right answer?
3. The graph of part of linear function h is shown on the grid.
(a) Write an inequality to represen...
Questions
Mathematics, 30.03.2021 20:50

Mathematics, 30.03.2021 20:50
Mathematics, 30.03.2021 20:50


Spanish, 30.03.2021 20:50
Mathematics, 30.03.2021 20:50
History, 30.03.2021 20:50

English, 30.03.2021 20:50
Mathematics, 30.03.2021 20:50
Mathematics, 30.03.2021 20:50


