
Mathematics, 28.09.2020 07:01 dondre54
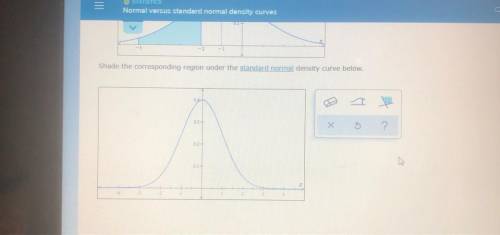
Below is a graph of a normal distribution with mean pt - 1 and standard deviation o 2. The shaded region represents the probability of obtaining a value
from this distribution that is between - 5 and -2.
Shade the corresponding region under the standard normal density curve below.

Answers: 2


Another question on Mathematics
Mathematics, 21.06.2019 15:10
5x + 2 = 12 solve the following equation. then place the correct number in the box provided.
Answers: 2
Mathematics, 21.06.2019 16:40
Which is the graph of f(x) = (4)x? image for option 1 image for option 2 image for option 3 image for option 4
Answers: 1
Mathematics, 21.06.2019 17:50
Find the cosine function that is represented in the graph.
Answers: 1
Mathematics, 21.06.2019 20:30
Ateam has p points. p = 3w + d w = wins d = draws a) a football team has 5 wins and 3 draws. how many points does the team have?
Answers: 1
You know the right answer?
Below is a graph of a normal distribution with mean pt - 1 and standard deviation o 2. The shaded re...
Questions


Computers and Technology, 15.11.2019 20:31


