
Mathematics, 28.09.2020 14:01 inlace1161
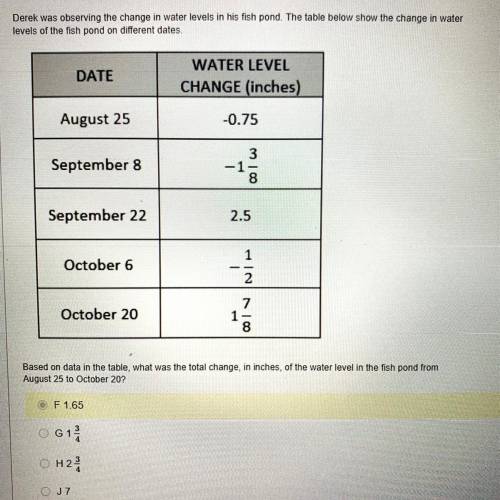
Derek was observing the change in water levels in his fish pond. The table below show the change in water
levels of the fish pond on different dates
DATE
WATER LEVEL
CHANGE (inches)
August 25
-0.75
September 8
3
-1
8
September 22
2.5
October 6
-
2
- 1/2
le
October 20
Based on data in the table, what was the total change, in inches, of the water level in the fish pond from
August 25 to October 207
F 1.65
61
O H2
J7

Answers: 2


Another question on Mathematics
Mathematics, 21.06.2019 19:00
Find the equation of the line with slope =8 and passing through (6,53) write your equation in the form y=mx+b
Answers: 1
Mathematics, 21.06.2019 21:00
Type the correct answer in each box. use numerals instead of words. if necessary, use / fir the fraction bar(s). the graph represents the piecewise function: h
Answers: 3
You know the right answer?
Derek was observing the change in water levels in his fish pond. The table below show the change in...
Questions

Mathematics, 12.07.2019 06:00


Social Studies, 12.07.2019 06:00
Mathematics, 12.07.2019 06:00
Mathematics, 12.07.2019 06:00
Mathematics, 12.07.2019 06:00

Geography, 12.07.2019 06:00

Spanish, 12.07.2019 06:00
Spanish, 12.07.2019 06:00
Social Studies, 12.07.2019 06:00

History, 12.07.2019 06:00
History, 12.07.2019 06:00
Mathematics, 12.07.2019 06:00


