
Mathematics, 28.09.2020 14:01 kaffolter25
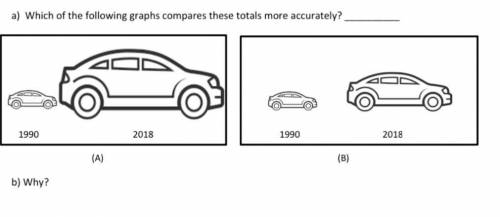
The average cost of a car in 1990 was $9,437 and the average cost of a car in 2018 was $36,113. Which of the following graphs compares these totals more accurately? ( stem, leaf) display

Answers: 2


Another question on Mathematics
Mathematics, 21.06.2019 14:30
Let f (x) = x e8x. find a formula for the nth derivative of f, where n is any positive integer. use x and n in your answer if needed. f (n)(x) =
Answers: 2
Mathematics, 21.06.2019 22:00
The table below lists recommended amounts of food to order for 10 party guests. how much of each food item should nathan and amanda order for a graduation party with 55 guests? use the table to answer. item amount fried chicken 16 pieces lasagna 7 pounds deli meats 1.8 pounds sliced cheese 1 and two fifths pounds bakery buns 1 dozen potato salad 2 pounds
Answers: 3
Mathematics, 22.06.2019 00:00
What is the distance from (–3, 1) to (–1, 5)? round your answer to the nearest hundredth. (4 points) a. 3.60 b. 4.12 c. 4.47 d. 5.66
Answers: 1
You know the right answer?
The average cost of a car in 1990 was $9,437 and the average cost of a car in 2018 was $36,113. Whic...
Questions

Mathematics, 19.02.2021 02:00
Mathematics, 19.02.2021 02:00

History, 19.02.2021 02:00
Mathematics, 19.02.2021 02:00

Physics, 19.02.2021 02:00
Business, 19.02.2021 02:00

Geography, 19.02.2021 02:00
History, 19.02.2021 02:00

Mathematics, 19.02.2021 02:00
Mathematics, 19.02.2021 02:00


Chemistry, 19.02.2021 02:00
Mathematics, 19.02.2021 02:00
Physics, 19.02.2021 02:00
Mathematics, 19.02.2021 02:00


