
Mathematics, 28.09.2020 23:01 hsnak
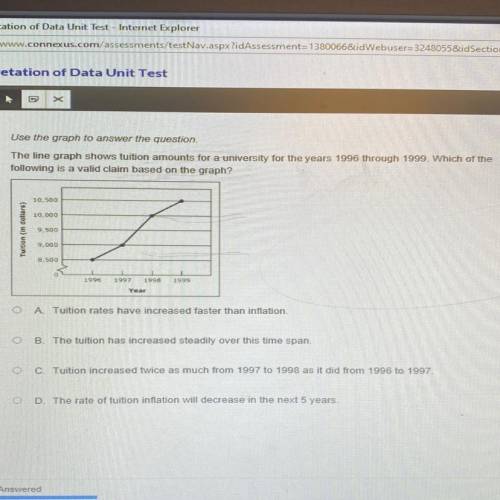
Use the graph to answer the question.
The line graph shows tuition amounts for a university for the years 1996 through 1999. Which of the
following is a valid claim based on the graph?
A Tuition rates have increased faster than inflation.
O
B. The tuition has increased steadily over this time span.
O
C. Tuition increased twice as much from 1997 to 1998 as it did from 1996 to 1997.
D. The rate of tuition inflation will decrease in the next 5 years.

Answers: 2


Another question on Mathematics
Mathematics, 21.06.2019 19:40
What is the range of the function? f(x)=-2|x+1|? a. all real numbers. b. all real numbers less than or equal to 0. c. all real numbers less than or equal to 1. d. all real numbers greater than or equal to 1
Answers: 2
Mathematics, 22.06.2019 00:30
The graph of f(x) is obtained by reflecting the graph of f(x)=-3|x| over the x-axis. which equation describes f(x)? a) f(x)=3|x| b) f(x)=|x+3| c) f(x)=-3|x| d) f(x) = - |x+3|
Answers: 1
Mathematics, 22.06.2019 01:30
This graph shows a portion of an odd function. use the graph to complete the table of values. x f(x) −2 −3 −4 −6
Answers: 3
You know the right answer?
Use the graph to answer the question.
The line graph shows tuition amounts for a university for the...
Questions


English, 26.03.2020 02:03
Mathematics, 26.03.2020 02:03


Mathematics, 26.03.2020 02:03
History, 26.03.2020 02:03

Geography, 26.03.2020 02:03


