
Mathematics, 29.09.2020 05:01 20jacksone
Help, please! :(
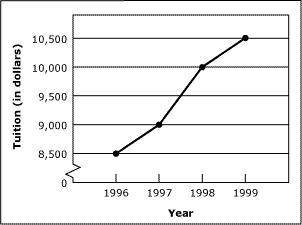
The line graph shows tuition amounts for a university for the years 1996 through 1999. Which of the following is a valid claim based on the graph?
(A): The greatest one-year increase in tuition occurred from 1997 to 1998.
(B): The rate of increase was the same from year to year.
(C): Tuition rates doubled between 1996 and 1999.
(D): Tuition rates will continue to increase over the next 5 years.

Answers: 3


Another question on Mathematics
Mathematics, 21.06.2019 15:00
The system of equations graphed below has how many solutions? y = 2x + 2
Answers: 1
Mathematics, 21.06.2019 18:10
An initial investment of $100 is now valued at $150. the annual interest rate is 5%, compounded continuously. the equation 100e0.05t = 150 represents the situation, where t is the number of years the money has been invested. about how long has the money been invested? use your calculator and round to the nearest whole number. years
Answers: 3
Mathematics, 21.06.2019 21:30
Julie goes to the sports store and spends $40.50 before tax. she buys a pair of shorts for $21.75 and 3 pairs of socks that each cost the same amount. how much does each pair of socks cost? $$
Answers: 1
Mathematics, 21.06.2019 22:30
What three-dimensional solid have 6 rectangular faces, 2 equal bases that are not rectangles and 18 edges
Answers: 3
You know the right answer?
Help, please! :(
The line graph shows tuition amounts for a university for the years 1996 through 1...
Questions

Mathematics, 19.04.2020 18:07

Biology, 19.04.2020 18:08
Mathematics, 19.04.2020 18:08

Mathematics, 19.04.2020 18:12

Mathematics, 19.04.2020 18:15
English, 19.04.2020 18:21

Physics, 19.04.2020 18:21
Mathematics, 19.04.2020 18:21
English, 19.04.2020 18:21
Mathematics, 19.04.2020 18:21
Mathematics, 19.04.2020 18:21


