
Mathematics, 30.09.2020 04:01 jacobballew2019
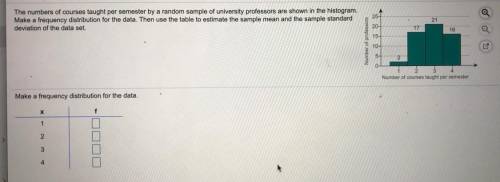
The numbers of courses taught per semester by a random sample of university professors are shown in the histogram.
Make a frequency distribution for the data. Then use the table to estimate the sample mean and the sample standard
deviation of the data set.
Make a frequency distribution for the data.
x f
1 _
2 _
3 _
4 _

Answers: 3


Another question on Mathematics
Mathematics, 21.06.2019 15:10
The highest point on earth is the peak of mount everest if you climb to the top you would be approximately 29,035 feet above sea level at remembering that amount is 5280 feet percentage of the height of the mountain would you have to climb to reach a point 2 miles above sea level
Answers: 2
Mathematics, 21.06.2019 21:30
Mama mia restaurant used 1 2 2 1 ? of their mozzarella cheese making pizza and the remaining 6 4 64 ounces making pasta. how many pounds of mozzarella cheese did mama mia start with?
Answers: 1
You know the right answer?
The numbers of courses taught per semester by a random sample of university professors are shown in...
Questions

Mathematics, 31.05.2020 03:58
Mathematics, 31.05.2020 03:58
Mathematics, 31.05.2020 03:58
Mathematics, 31.05.2020 03:58
Mathematics, 31.05.2020 03:58

Business, 31.05.2020 03:58

Chemistry, 31.05.2020 03:58

English, 31.05.2020 03:58

French, 31.05.2020 03:58
Chemistry, 31.05.2020 03:58
Mathematics, 31.05.2020 03:58


