Which of the following best describes the graph below?
27
1
1
2
A. It is no...

Mathematics, 02.10.2020 09:01 Alex9089435028
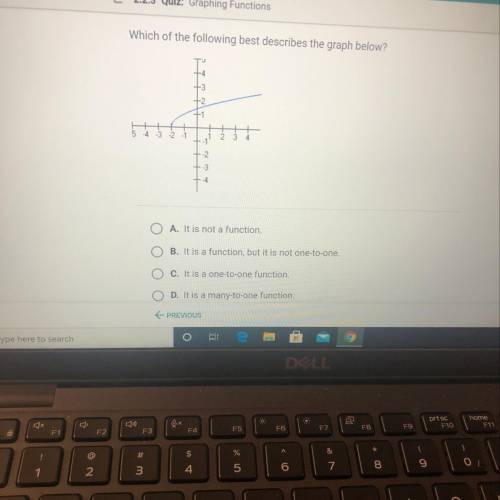
Which of the following best describes the graph below?
27
1
1
2
A. It is not a function.
B. It is a function, but it is not one-to-one.
ОО ОО
C. It is a one-to-one function.
D. It is a many-to-one function

Answers: 3


Another question on Mathematics
Mathematics, 21.06.2019 13:00
What is the exact area of a circle with a diameter of 50 centimeters? a.87.9 square centimeters b.379.9 square centimeters c.1962.5 square centimeters d.4923.5 square centimeters
Answers: 1
Mathematics, 21.06.2019 16:30
An empty bucket is placed under a faucet dripping at a constant rate of 4 milliliters per minute. with the given information, which of these statements is a reasonable conclusion? a there will be 24 milliliters of water in the bucket after 16 hour. b there will be 60 milliliters of water in the bucket after 14 hour. c there will be 160 milliliters of water in the bucket after 20 minutes. d there will be 100 milliliters of water in the bucket after 40 minutes.
Answers: 1
Mathematics, 21.06.2019 17:30
What is not true about kl and mn? what is mn? (show your work)
Answers: 1
You know the right answer?
Questions

Geography, 29.04.2021 07:20
Mathematics, 29.04.2021 07:20
Mathematics, 29.04.2021 07:20


English, 29.04.2021 07:20


Chemistry, 29.04.2021 07:20

History, 29.04.2021 07:30
Mathematics, 29.04.2021 07:30
Mathematics, 29.04.2021 07:30


