
Mathematics, 02.10.2020 14:01 gonzalesalexiaouv1bg
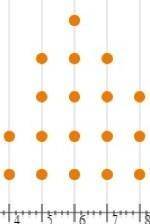
The data for numbers of times per week 18 students at Whackamole High eat meat are shown below: Part A: Describe the dotplot Part B: What, if any, are the outliers in these data? Show your work Part 2: What is the best measure of center for these data? Explain your reasoning

Answers: 1


Another question on Mathematics
Mathematics, 21.06.2019 17:00
This figure consists of a rectangle and semicircle. what is the perimeter of this figure use 3.14 for pi 60.84m 72.84m 79.68m 98.52m
Answers: 2
Mathematics, 21.06.2019 17:00
According to modern science, earth is about 4.5 billion years old and written human history extends back about 10,000 years. suppose the entire history of earth is represented with a 10-meter-long timeline, with the birth of earth on one end and today at the other end.
Answers: 2
Mathematics, 21.06.2019 19:40
What is the slope of the line that contains the points (-2,1) and (0,-3)
Answers: 2
Mathematics, 21.06.2019 23:30
Savannah had 40 iris blooms last year this year she had 15% more iris blooms how many more hours blooms did savannah have this year
Answers: 1
You know the right answer?
The data for numbers of times per week 18 students at Whackamole High eat meat are shown below: Part...
Questions

Mathematics, 01.03.2021 18:30
Mathematics, 01.03.2021 18:30


Business, 01.03.2021 18:30

Spanish, 01.03.2021 18:30
Mathematics, 01.03.2021 18:30
Mathematics, 01.03.2021 18:30
Mathematics, 01.03.2021 18:30
Mathematics, 01.03.2021 18:30

Mathematics, 01.03.2021 18:30

Advanced Placement (AP), 01.03.2021 18:30
Mathematics, 01.03.2021 18:30


