
Mathematics, 05.10.2020 15:01 rehooreh14
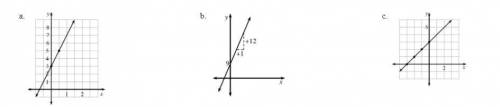
For each graph below:
-Describe how the pattern grows and how many tiles are in figure 0. x represents the figure number, and y represents the number of tiles in the figure
-Write an equation that relates the figure number, x, to the number of tiles, y
-Decide if the graph represents a function. If so, write the equation using function notation. If not, explain why the graph does not represent a function

Answers: 2


Another question on Mathematics
Mathematics, 21.06.2019 14:30
Using the given statements, state whether the conditional statement is true or false. p: 2 + 2 = 4 q: 7 + 1 = 7 is p q true or false?
Answers: 1
Mathematics, 21.06.2019 18:00
Ijust need to see how to do this. so you don’t have to answer all of them just a step by step explanation of one.
Answers: 3
Mathematics, 21.06.2019 20:00
Can you me find the missing length. i attached an image.
Answers: 1
Mathematics, 21.06.2019 23:30
Atruck can be rented from company a $50 a day plus $0.60 per mile. company b charges $20 a day plus $0.80 per mile to rent the same truck. find the number of miles in a day at which the rental costs for company a and company b are the same
Answers: 1
You know the right answer?
For each graph below:
-Describe how the pattern grows and how many tiles are in figure 0. x represe...
Questions


Mathematics, 25.05.2021 19:20
Mathematics, 25.05.2021 19:20

Mathematics, 25.05.2021 19:20

History, 25.05.2021 19:20

Mathematics, 25.05.2021 19:20
Mathematics, 25.05.2021 19:20
English, 25.05.2021 19:20
Mathematics, 25.05.2021 19:20
Biology, 25.05.2021 19:20


