Who
is table on your answer sheet.
The table below shows the sales for a flower company for t...

Mathematics, 05.10.2020 18:01 tdowling331
Who
is table on your answer sheet.
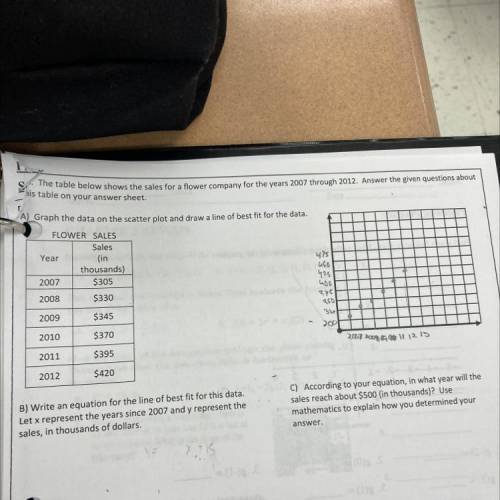
The table below shows the sales for a flower company for the years 2007 through 2012. Answer the given questions about
A) Graph the data on the scatter plot and draw a line of best fit for the data,
5
5
FLOWER SALES
Sales
Year
(in
thousands)
2007 $305
475
ubo
425
2008
$330
27
2009
$345
2010
$370
SO 11 12 13
2011
$395
2012
$420
B) Write an equation for the line of best fit for this data.
Let x represent the years since 2007 and y represent the
sales, in thousands of dollars.
C) According to your equation, in what year will the
sales reach about $500 (in thousands)? Use
mathematics to explain how you determined your
answer.

Answers: 3


Another question on Mathematics
Mathematics, 21.06.2019 21:50
Match each whole number with a rational, exponential expression 3 square root 27^2find the domain and range of the exponential function h(x)=125^x. explain your findings. as x decreases does h increase or decrease? explain. as x increases does h increase or decrease? explain.
Answers: 3
Mathematics, 22.06.2019 00:30
The mean average cost of standard room per night at a hostel is ? 20.60. therefore, how much does a standard room cost per night at night-time rest days?
Answers: 1
Mathematics, 22.06.2019 02:00
Alexandra drove from michigan to colorado to visit her friend. the speed limit on the highway is 70 miles per hour. if alexandra's combined driving time for the trip was 14 hours how many miles did alejandra drive?
Answers: 1
You know the right answer?
Questions

Social Studies, 20.05.2020 08:00

English, 20.05.2020 08:00
Social Studies, 20.05.2020 08:00
English, 20.05.2020 08:00
Mathematics, 20.05.2020 08:00

Business, 20.05.2020 08:00

Mathematics, 20.05.2020 08:00
Mathematics, 20.05.2020 08:00
History, 20.05.2020 08:00
History, 20.05.2020 08:00

Biology, 20.05.2020 08:00
Engineering, 20.05.2020 08:00


