
Mathematics, 06.10.2020 18:01 jis0
Please answer! I’m desperate.
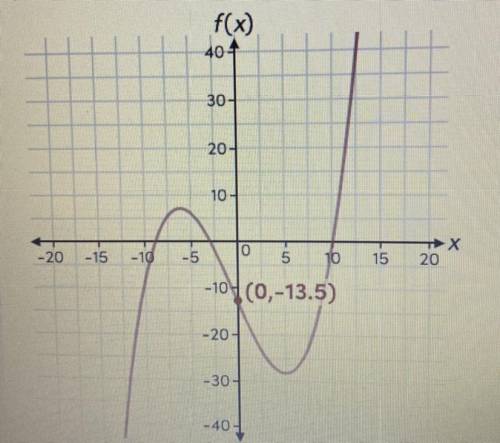
Jared is an intern at a real estate broker’s office. He was asked to record data on the difference of the number of sales made each month by the whole team of realtors and the average number of sales made by similar broker’s offices.
After gathering the current year’s data, Jared decided to include the previous year’s data as well. Using all of the data, he created this function
to model the team’s sales, where X is the number of months since January, when Jared began gathering data, and f(x) is the number of sales as compared with the average. (Shown in picture)
1.) Use the graph to interpret and match the approximate intervals with their descriptions. Drag the tiles to the correct boxes. Not all tiles will be used.
Tiles: (-6.3, 10), (-3, 10), (-9, 0), (4.9, 10), (0, 4.9), (-9, -3)
Pairs:
interval over which the difference of the numbers of the sales is increasing =
interval over which the difference of the numbers of sales is negative =
interval over which the difference of the numbers of sales is increasing =
interval over which the difference of the numbers of sales is positive =
2.) Use graph to complete the statements. Select the correct answer from the drop-down menu.
The team’s total number of sales is equal to the average number of sales at BLANK months from when Jared began gathering data
options: -6.3 and 5; -9, -3, and 10; 3, 9, and 10; -13.5
The team’s minimum number is sales this year occurred at approximately BLANK months from when Jared began gathering data.
options: 7; -6; 5; 0; -28
3.) What are the factors of the equation representing Jared’s function? Select all that apply.
(x-10)
(x-9)
(x+10)
(x+3)
(x+9)
(x-3)
4.) Use the factors of the function and the y-intercept to find the standard form of the equation representing Jared’s function. Type the correct answer in the box.
5.) Jared also gathered data from a competing real estate broker’s office. The competitor’s sales were equal to the average number of sales 8 months before Jared begun gathering data and again 2 and 6 months after he began gathering data. The relative minimum number of sales was lower than the relative minimum number of sales of Jared’s office.
Use the sliders for a, b, c, and d to create a graph that could model the competitor’s number of sales.
That’s all! If you answer I greatest appreciate it and you’ll get BRAINLIEST!

Answers: 2


Another question on Mathematics
Mathematics, 21.06.2019 21:00
Atorch and a battery cost 2.50 altogether.the torch costs 1.50 more than the battery.what fraction of the total price is the torch? give your answer in its simplest form.
Answers: 2
Mathematics, 21.06.2019 23:40
Put the following steps for calculating net worth in the correct order
Answers: 1
Mathematics, 22.06.2019 00:00
4. bob solved the inequality problem below incorrectly. explain his error and redo the problem showing the correct answer. −2x + 5 < 17 −2x + 5-5 < 17-5 -2x/-2 < 12/-2 x < -6
Answers: 2
You know the right answer?
Please answer! I’m desperate.
Jared is an intern at a real estate broker’s office. He was asked to...
Questions

Mathematics, 27.04.2021 17:30
Mathematics, 27.04.2021 17:30
Social Studies, 27.04.2021 17:30

Chemistry, 27.04.2021 17:30


History, 27.04.2021 17:30
English, 27.04.2021 17:30
Social Studies, 27.04.2021 17:30
Mathematics, 27.04.2021 17:30
Mathematics, 27.04.2021 17:30
Mathematics, 27.04.2021 17:30


