
Mathematics, 07.10.2020 09:01 juliann9160
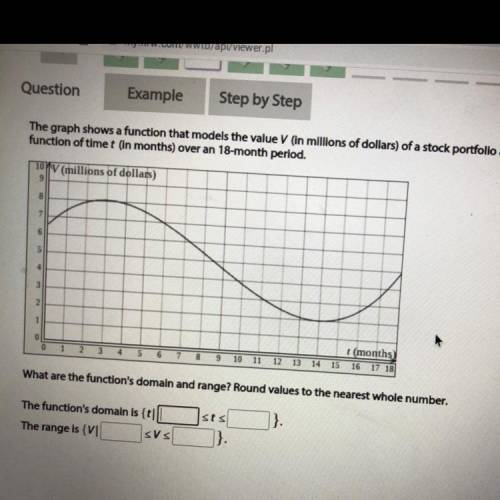
The graph shows a function that models the value V (in millions of dollars) of a stock portfolio as a
function of timet (In months) over an 18-month period.
10 V (millions of dollars)
9
8
7
6
s
4
3
2
1
0
0
t(months
3 4 5 6 7 8 9 10 11 12 13 14 15 16 17 18
What are the function's domain and range? Round values to the nearest whole number.
The function's domain is {t|
The range is {V1 SVS
}
sts
}

Answers: 1


Another question on Mathematics
Mathematics, 21.06.2019 18:30
Me complete this proof! prove that a quadrilateral is a square. me with the steps for this proof.
Answers: 1
Mathematics, 22.06.2019 03:20
The equation ip| = 2 represents the total number of points that can be earned or lost during one turn of a game. which best describes how many points can be earned or lost during one turn?
Answers: 2
Mathematics, 22.06.2019 04:30
Marcy is conducting a study regarding the amount of time students at her school spend talking to friends online. which group would give marcy the best results for her study?
Answers: 3
Mathematics, 22.06.2019 05:00
Caleb and emily are standing 100 yards from each other. caleb looks up at a 45° angle to see a hot air balloon. emily looks up at a 60° angle to see the same hot air balloon. approximately how far is the hot air balloon off the ground? a)44.2 yd. b)63.4 yd. c)73.2 yd. d)89.7 yd.
Answers: 3
You know the right answer?
The graph shows a function that models the value V (in millions of dollars) of a stock portfolio as...
Questions

English, 12.10.2020 21:01
Mathematics, 12.10.2020 21:01
Mathematics, 12.10.2020 21:01

English, 12.10.2020 21:01

English, 12.10.2020 21:01
Mathematics, 12.10.2020 21:01

History, 12.10.2020 21:01


Mathematics, 12.10.2020 21:01


