subject
Mathematics, 07.10.2020 20:01 marifermolina

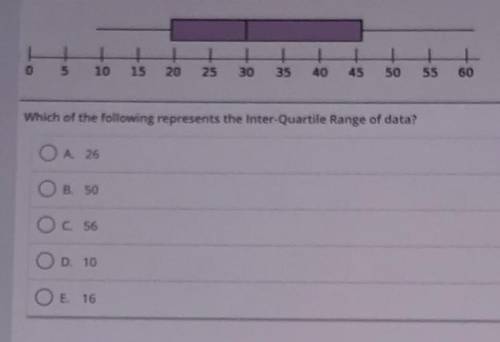
Which of the following represents the Inter-Quartile Range of data? A 26
B 50
C. 56
D. 10
E 16


Which of the following represents the Inter-Quartile Range of data?

A 26
B 50
C. 56
D. 10
E 16

ansver
Answers: 1

Another question on Mathematics

question
Mathematics, 21.06.2019 16:00
Which is the graph of the piecewise function f(x)? f(x)=[tex]f(x) = \left \{ {{-x+1, x\leq 0 } \atop {x+1, x\ \textgreater \ 0}} \right.[/tex]
Answers: 3
question
Mathematics, 21.06.2019 19:50
Is it greater than or less than7*3_9*2
Answers: 2
question
Mathematics, 21.06.2019 20:30
Acompany produces packets of soap powder labeled โ€œgiant size 32 ounces.โ€ the actual weight of soap powder in such a box has a normal distribution with a mean of 33 oz and a standard deviation of 0.7 oz. to avoid having dissatisfied customers, the company says a box of soap is considered underweight if it weighs less than 32 oz. to avoid losing money, it labels the top 5% (the heaviest 5%) overweight. how heavy does a box have to be for it to be labeled overweight?
Answers: 3
question
Mathematics, 21.06.2019 20:30
Tom is the deli manager at a grocery store. he needs to schedule employee to staff the deli department for no more that 260 person-hours per week. tom has one part-time employee who works 20 person-hours per week. each full-time employee works 40 person-hours per week. write and inequality to determine n, the number of full-time employees tom may schedule, so that his employees work on more than 260 person-hours per week. graph the solution set to this inequality.
Answers: 2
You know the right answer?
Which of the following represents the Inter-Quartile Range of data? A 26
B 50
C. 56
Questions
question
Mathematics, 14.01.2020 18:31
question
Mathematics, 14.01.2020 18:31
Questions on the website: 13722362