
Mathematics, 10.10.2020 14:01 Theresab2021
20 POINTSSS
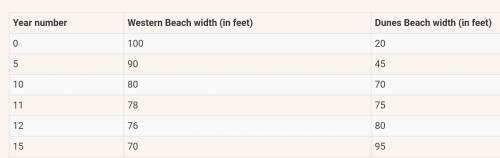
Two ocean beaches are being affected by erosion. The table shows the width, in feet, of each beach measured at high tide where 1995 is represented by year 0:
(Look at the picture)
Describe the patterns shown by the erosion data measurements shown for each of the beaches in the table.
Between which years will the beaches have approximately the same width?
Assuming these rates remain constant, what can you do to get a better approximation of when the two beaches will have the same width?

Answers: 1


Another question on Mathematics
Mathematics, 21.06.2019 14:30
Paint color preference children adults total 0.6 0.77 liked new paint color disliked new paint color 0.4 0.15 0.23 total 1.0 1.0 1.0 which value for x completes the conditional relative frequency table by column?
Answers: 2
Mathematics, 21.06.2019 16:30
11. minitab software was used to find the lsrl for a study between x=age and y=days after arthroscopic shoulder surgery until an athlete could return to their sport. use the output to determine the prediction model and correlation between these two variables. predictor coef se coef t p constant -5.054 4.355 -1.16 0.279 age 0.2715 0.1427 1.9 0.094 r-sq = 31.16%
Answers: 2
Mathematics, 21.06.2019 21:00
Find the perimeter of the triangle with vertices d(3, 4), e(8, 7), and f(5, 9). do not round before calculating the perimeter. after calculating the perimeter, round your answer to the nearest tenth.
Answers: 1
Mathematics, 22.06.2019 00:00
Y+ 2/y is it a polynomial in one variable or not? and if so, why?
Answers: 1
You know the right answer?
20 POINTSSS
Two ocean beaches are being affected by erosion. The table shows the width, in feet, of...
Questions


History, 26.07.2019 11:30

Biology, 26.07.2019 11:30
History, 26.07.2019 11:30


Chemistry, 26.07.2019 11:30


