
Mathematics, 11.10.2020 14:01 JocelynC24
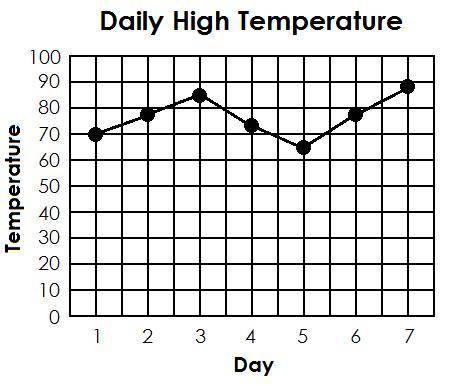
Stephanie collected data about the high temperature in her city for 7 days in a row. The high temperatures for the 7 days were 70, 78, 85, 73, 65, 78, and 89. She made the following graph to show her data.
She says the temperature in her city is pretty consistent, How could she redraw the graph so that the daily temperature doesnt seem quite so consistent?
(Not a multiple choice)

Answers: 2


Another question on Mathematics
Mathematics, 21.06.2019 19:50
Which of the following describes the graph of y--4x-36 compared to the parent square root function? stretched by a factor of 2, reflected over the x-axis, and translated 9 units right stretched by a factor of 2, reflected over the x-axis, and translated 9 units left stretched by a factor of 2, reflected over the y-axis, and translated 9 units right stretched by a factor of 2, reflected over the y-axis, and translated 9 units left save and exit next submit
Answers: 1
Mathematics, 21.06.2019 23:30
The perimeter of an equilateral triangle is 4 cm more than the perimeter of a square and the length of a side of the triangle is 8 cm more than the length of a side of the aware. find the length of a side of the equilateral triangle
Answers: 1
Mathematics, 22.06.2019 00:50
Show all work to identify the discontinuity and zero of the function f of x equals 6 x over quantity x squared minus 36
Answers: 1
Mathematics, 22.06.2019 01:30
Atriangle has side lengths of x, x+11, and 3x+5. what is the perimeter? question 1 options: 3x2+38x+55 3x3+38x2+55x 5x+16 4x+16
Answers: 2
You know the right answer?
Stephanie collected data about the high temperature in her city for 7 days in a row. The high temper...
Questions

Mathematics, 20.06.2020 21:57


History, 20.06.2020 21:57


Computers and Technology, 20.06.2020 21:57


