
Mathematics, 12.10.2020 01:01 elvia261
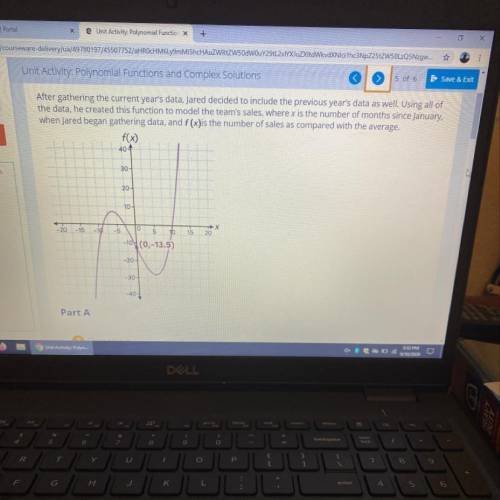
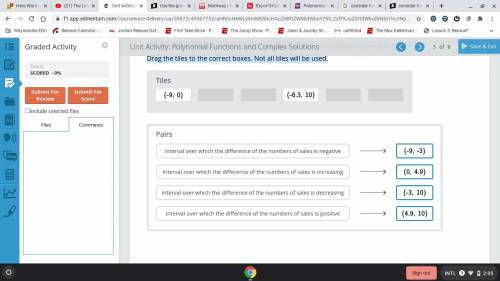
Use the graph to interpret and match the approximate intervals with their descriptions.
Drag the tiles to the correct boxes. Not all tiles will be used.
Tiles
(-9, -3)
(-9,0)
(0, 4.9)
(-6.3, 10)
(-3, 10)
(4.9, 10)
Pairs
Interval over which the difference of the numbers of sales is negative
Interval over which the difference of the numbers of sales is increasing
interval over which the difference of the numbers of sales 15 positive
Interval over which the difference of the numbers of tale decreasing

Answers: 1


Another question on Mathematics
Mathematics, 21.06.2019 21:00
Rewrite the following quadratic functions in intercept or factored form. show your work. y = 4x^2 - 19x- 5
Answers: 2
Mathematics, 22.06.2019 00:30
On ryan's last social studies test there were two types of questions true/false worth 3 points each and multiple choice questions worth 4 points each
Answers: 3
Mathematics, 22.06.2019 02:50
The angle of depression from the top of the tree to the tip of the shadow is 25°. find the height of the tree to the nearest tenth. a. 16.8 feet b. 18.2 feet c. 23.4 feet d. 39.7 feet
Answers: 2
You know the right answer?
Use the graph to interpret and match the approximate intervals with their descriptions.
Drag the ti...
Questions


History, 07.12.2020 03:50
Mathematics, 07.12.2020 03:50
Mathematics, 07.12.2020 03:50
History, 07.12.2020 03:50

Mathematics, 07.12.2020 03:50
Chemistry, 07.12.2020 03:50
Mathematics, 07.12.2020 03:50

English, 07.12.2020 03:50

Health, 07.12.2020 03:50
Chemistry, 07.12.2020 03:50
Mathematics, 07.12.2020 03:50
Mathematics, 07.12.2020 03:50

Geography, 07.12.2020 03:50


