
Mathematics, 12.10.2020 21:01 seseluka
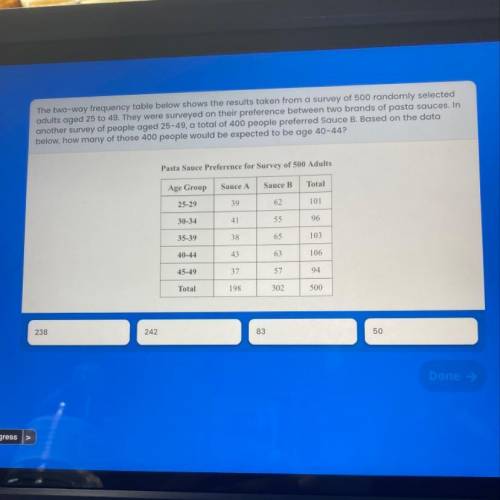
The two-way frequency table below shows the results taken from a survey of 500 randomly selected
adults aged 25 to 49. They were surveyed on their preference between two brands of pasta sauces. In
another survey of people aged 25-49, a total of 400 people preferred Sauce B. Based on the data
below, how many of those 400 people would be expected to be age 40-44?

Answers: 1


Another question on Mathematics
Mathematics, 21.06.2019 17:00
If a baby uses 15 diapers in 2 days, how many diapers will the baby use in a year?
Answers: 2
Mathematics, 21.06.2019 18:50
The number of fish in a lake can be modeled by the exponential regression equation y=14.08 x 2.08^x where x represents the year
Answers: 3
Mathematics, 22.06.2019 02:50
Triangle dog was rotated to create triangle d'o'g'. describe the transformation using details and degrees.
Answers: 3
Mathematics, 22.06.2019 03:00
Plz asap what is the range of the cluster in the scatter plot a. between 4 and 8 years of experience b. between $40,000 and $60,000 c. between 6 and 12 years of experience d. between $10,000 and $60,000
Answers: 2
You know the right answer?
The two-way frequency table below shows the results taken from a survey of 500 randomly selected
ad...
Questions

History, 26.03.2020 11:28
Mathematics, 26.03.2020 11:28
Mathematics, 26.03.2020 11:29
Mathematics, 26.03.2020 11:30

English, 26.03.2020 11:31
Mathematics, 26.03.2020 11:31
Mathematics, 26.03.2020 11:32
Mathematics, 26.03.2020 11:33
Mathematics, 26.03.2020 11:34
Mathematics, 26.03.2020 11:34
Mathematics, 26.03.2020 11:34
Mathematics, 26.03.2020 11:34


