
Mathematics, 12.10.2020 23:01 Camill0310
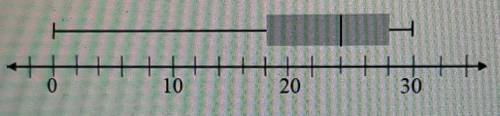
This box and whisker plot was made to represent how many days in a month employees at an office ate breakfast. Read the following pieces of data from the graph.
Range:
A. 18 B. 30 C. 24 D. 10
Median:
A. 24 B. 30 C. 15 D. 18

Answers: 2


Another question on Mathematics
Mathematics, 21.06.2019 17:00
Jose bought 20 shares of netflix at the close price of $117.98. in a few years, jose sells all of his shares at $128.34. how much money did jose make? a.) $192.50 b.) $207.20 c.) $212.50 d.) $224.60
Answers: 1
Mathematics, 21.06.2019 18:30
Anormally distributed data set has a mean of 176.3 and a standard deviation of 4.2. what is the approximate z-score for the data value of 167.9? 2.00 −2.00 8.4 −8.4
Answers: 2
Mathematics, 21.06.2019 21:30
Jalen charges $25.50 for every 3 hours of yard work he does for his neighbors. ralph charges $34 for every 4 hours of work that he does. who charges less? opinions: 1.they charge the same amount 2.jalen 3.ralph
Answers: 1
Mathematics, 21.06.2019 22:00
Iam at home. /: i am playing video games. translate the following statement into symbolic form.
Answers: 2
You know the right answer?
This box and whisker plot was made to represent how many days in a month employees at an office ate...
Questions
Mathematics, 18.08.2021 23:10

English, 18.08.2021 23:10

Social Studies, 18.08.2021 23:10

History, 18.08.2021 23:10


Social Studies, 18.08.2021 23:10
Mathematics, 18.08.2021 23:10
English, 18.08.2021 23:10

Geography, 18.08.2021 23:10

Chemistry, 18.08.2021 23:10


