
Mathematics, 13.10.2020 03:01 jcox626
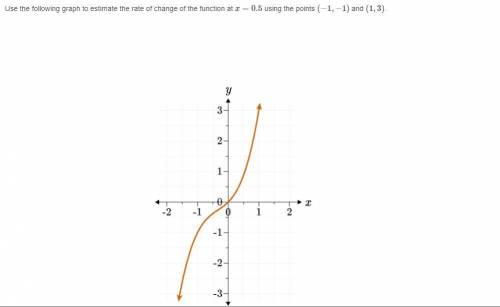
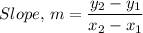
2.Use the following graph to estimate the rate of change of the function at x=0.5 using the points (−1,−1) and (1,3)
A. The rate of change is −1/2.
B. The rate of change is 2.
C. The rate of change is 1/2.
D. The rate of change is −2.
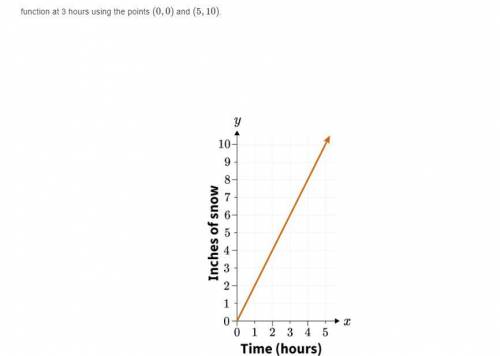
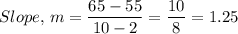
3.The following graph shows the inches of snow on the ground over a certain number of hours. Use the graph to estimate the rate of change of the function at 3 hours using the points (0,0) and (5,10)
A. The rate of change is −1/2 of an inch per hour.
B. The rate of change is 1/2 of an inch per hour.
C. The rate of change is 2 inches per hour.
D. The rate of change is −2 inches per hour.
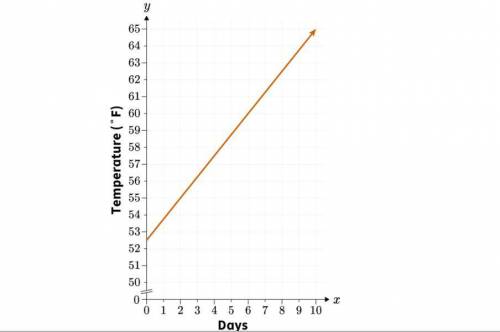
4.The following graph shows the average temperatures in degrees Fahrenheit (°F) over the days of a month. Use the graph to estimate the rate of change of the function at the ninth day of the month using the points (2,55) and (10,65)
A. The rate of change is 0.8 degrees Fahrenheit per day.
B. The rate of change is 1.25 degrees Fahrenheit per day.
C. The rate of change is −0.8 degrees Fahrenheit per day.
D. The rate of change is −1.25 degrees Fahrenheit per day.
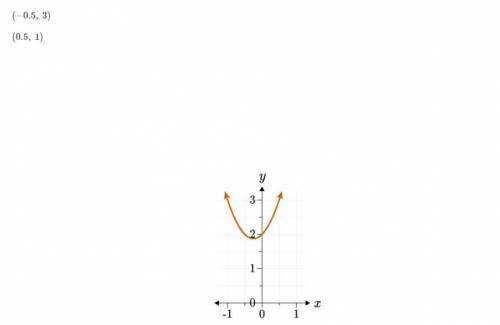
5.Use the following graph to answer which of the following points would provide the most accurate estimation for the rate of change of the function as it crosses the y-axis. Explain.
(−0.5, 2)
(0.5, 3)
(−0.5, 3)
(0.5, 1)
A.(−0.5, 3) and (0.5, 1) would provide the most accurate estimation. The slope of the line drawn between these two points appears closest to the slope of the function at x=0.
B.(−0.5, 2) and (0.5, 3) would provide the most accurate estimation. The slope of the line drawn between these two points appears closest to the opposite of the slope of the function at x=0.
C.(−0.5, 2) and (0.5, 3) would provide the most accurate estimation. The slope of the line drawn between these two points appears closest to the slope of the function at x=0.
D.(−0.5, 3) and (0.5, 1) would provide the most accurate estimation. The slope of the line drawn between these two points appears closest to the opposite of the slope of the function at x=0.

Answers: 3


Another question on Mathematics
Mathematics, 21.06.2019 22:20
Which graph has figures that can undergo a similarity transformation to justify that they are similar? (obviously not the third one)
Answers: 2
Mathematics, 22.06.2019 01:50
Algebraically prove that a clockwise and counterclockwise rotation of 180° about the origin for triangle abc are equivalent rotations.
Answers: 2
Mathematics, 22.06.2019 03:00
For the following equations, find the ratio of a to b. be sure to show all of your work. a. 3a = 6b b. 15a = 5b
Answers: 2
You know the right answer?
2.Use the following graph to estimate the rate of change of the function at x=0.5 using the points (...
Questions
Mathematics, 08.06.2021 08:30


Mathematics, 08.06.2021 08:30

World Languages, 08.06.2021 08:30

Spanish, 08.06.2021 08:30
Mathematics, 08.06.2021 08:30

Computers and Technology, 08.06.2021 08:30


Arts, 08.06.2021 08:30
Mathematics, 08.06.2021 08:30
Mathematics, 08.06.2021 08:40

Social Studies, 08.06.2021 08:40
Mathematics, 08.06.2021 08:40


