
Mathematics, 14.10.2020 21:01 nicoleamor
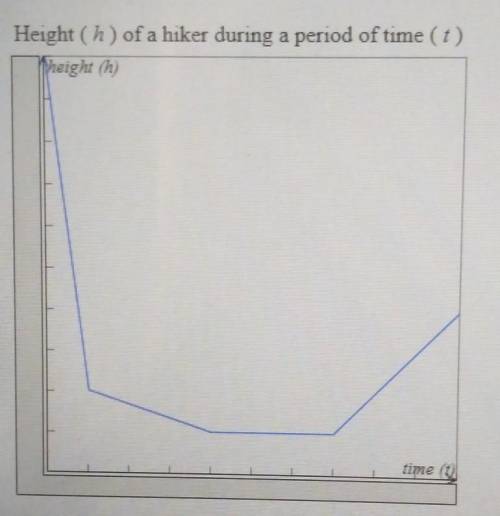
The graph shown represents the height (h) of a hiker during a period of time (t). Use the vertical line test to determine if the relation represented on the graph is a function. Complete the explanation. since___vertical line will pass through more than one point, the graph_the vertical lines test so the relation_ a function

Answers: 2


Another question on Mathematics
Mathematics, 21.06.2019 16:00
What two criteria are needed for triangles to be similar
Answers: 2
Mathematics, 21.06.2019 17:00
The vet charges $45 for an office visit and $10 for each vaccination your dog needs. write an eaquation
Answers: 1
Mathematics, 21.06.2019 19:30
Look at this pattern ; 1,4,9, number 10000 belongs in this pattern . what’s the place of this number?
Answers: 3
Mathematics, 21.06.2019 22:30
Sketch the vector field vector f( vector r ) = 8vector r in the xy-plane. select all that apply. the length of each vector is 8. the lengths of the vectors decrease as you move away from the origin. all the vectors point away from the origin. all the vectors point in the same direction. all the vectors point towards the origin. the lengths of the vectors increase as you move away from the origin.
Answers: 2
You know the right answer?
The graph shown represents the height (h) of a hiker during a period of time (t). Use the vertical l...
Questions


Chemistry, 03.12.2019 03:31

Geography, 03.12.2019 03:31

Mathematics, 03.12.2019 03:31

Chemistry, 03.12.2019 03:31
Mathematics, 03.12.2019 03:31
Geography, 03.12.2019 03:31
Mathematics, 03.12.2019 03:31

Spanish, 03.12.2019 03:31
Mathematics, 03.12.2019 03:31
Mathematics, 03.12.2019 03:31
English, 03.12.2019 03:31


