
Mathematics, 15.10.2020 04:01 korban23
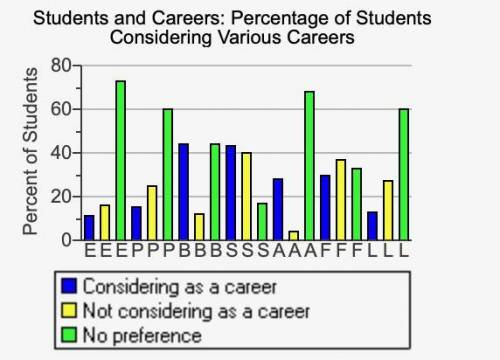
The bar graph on the right shows the percentage of students at a local high school with preferences for
various careers, Career E is elementary school teacher, P is police officer, B is banker, S is surgeon, A is
airline pilot, F is family doctor, and L is lawyer. Use the graph to place the airline pilot career in the correct
region of the Venn diagram, also on the right, where U is the set of careers, A is the set of careers for
which more than 20% of students are considering as a career, and B is the set of careers for which more
than 20% of students are not considering as a career.
In which region does the airline pilot career belong?

Answers: 3


Another question on Mathematics
Mathematics, 21.06.2019 15:10
Abig remake 100 loaves of bread in one day how many loaves does the bakery make in 6 days
Answers: 1
Mathematics, 21.06.2019 18:00
Which shows the correct solution of the equation 1/2a+2/3b=50, when b=30?
Answers: 1
Mathematics, 21.06.2019 20:00
Ke’ajah has a coupon for 1/3 off the regular price, t, of a tent. which expression represents the price of the tent using the coupon? select the two correct expressions. a. 1/3t b. 2/3t c. t - 1/3 d. t - 2/3 e. t - 1/3t f. t - 2/3t
Answers: 1
Mathematics, 21.06.2019 20:00
Michelle and julie work at a catering company. they need to bake 264 cookies for a birthday party that starts in a little over an hour and a half. each tube of cookie dough claims to make 36 cookies, but michelle eats about 1/5 of every tube and julie makes cookies that are 1.5 times as large as the recommended cookie size.it takes about 8 minutes to bake a container of cookies, but since julie's cookies are larger, they take 12 minutes to bake. a. how many tubes should each girl plan to bake? how long does each girl use the oven? b. explain your solution process what did you make? c. what assumptions did you make?
Answers: 2
You know the right answer?
The bar graph on the right shows the percentage of students at a local high school with preferences...
Questions

Biology, 08.09.2021 22:40
Mathematics, 08.09.2021 22:40

SAT, 08.09.2021 22:40
English, 08.09.2021 22:40

Medicine, 08.09.2021 22:40

History, 08.09.2021 22:40
Mathematics, 08.09.2021 22:40
Mathematics, 08.09.2021 22:40

Mathematics, 08.09.2021 22:40
Mathematics, 08.09.2021 22:40
Chemistry, 08.09.2021 22:40

Arts, 08.09.2021 22:40


