
Mathematics, 15.10.2020 09:01 les6965
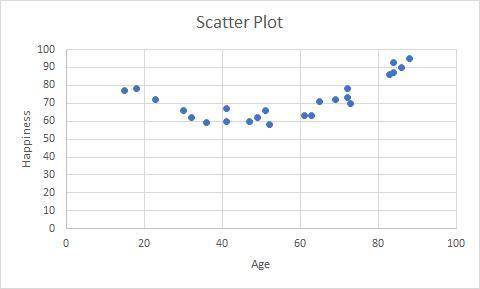
Many attempts have been made to relate happiness with various factors. One such study relates happiness with age and finds that holding everything else constant, people are least happy when they are in their mid-40s (The Economist, December 16, 2010). Data are collected on a respondent’s age and his/her perception of well-being on a scale from 0 to 100; the data is presented below.
Age Happiness
49 62
51 66
41 67
65 71
84 87
41 60
83 86
18 78
36 59
61 63
15 77
86 90
73 70
32 62
84 93
23 72
52 58
72 73
63 63
30 66
72 78
47 60
88 95
69 72
Required:
a. Calculate the sample correlation coefficient between age and happiness.
b. Interpret the sample correlation coefficient between age and happiness.
c. Draw a scatterplot to evaluate your interpretation of the calculated sample correlation value.

Answers: 2
![Sample correlation coefficient=r=\frac{nsumxy-(sumx)(sumy)}{[nsumx^{2}-(sumx)^2][ nsumy^{2}-(sumy)^2] }](/tpl/images/0807/0464/1337f.png)
![Sample correlation coefficient=r=\frac{24(99485)-(1335)(178)}{[24(86089)-(1335)^2][ 24(127346)-(1728)^2] }](/tpl/images/0807/0464/bcfb1.png)


Another question on Mathematics
Mathematics, 21.06.2019 15:30
Sunday: 1 1 2 monday: 1 tuesday: 2 1 2 wednesday: 1 3 4 thursday: 2 friday: 1 1 2 saturday: 2 jenna is a swimmer and trains every day. the schedule shown outlines the number of hours she trains each day. what is the total number of hours that jenna trains during the week?
Answers: 3
Mathematics, 21.06.2019 23:30
Arestaurant added a new outdoor section that was 8 feet wide and 6 feet long. what is the area of their new outdoor section
Answers: 1
You know the right answer?
Many attempts have been made to relate happiness with various factors. One such study relates happin...
Questions


History, 02.12.2020 23:00

Arts, 02.12.2020 23:00

Social Studies, 02.12.2020 23:00
History, 02.12.2020 23:00
Mathematics, 02.12.2020 23:00
Mathematics, 02.12.2020 23:00
Mathematics, 02.12.2020 23:00
Engineering, 02.12.2020 23:00
Social Studies, 02.12.2020 23:00
Mathematics, 02.12.2020 23:00

Health, 02.12.2020 23:00

Computers and Technology, 02.12.2020 23:00
Mathematics, 02.12.2020 23:00

Geography, 02.12.2020 23:00


