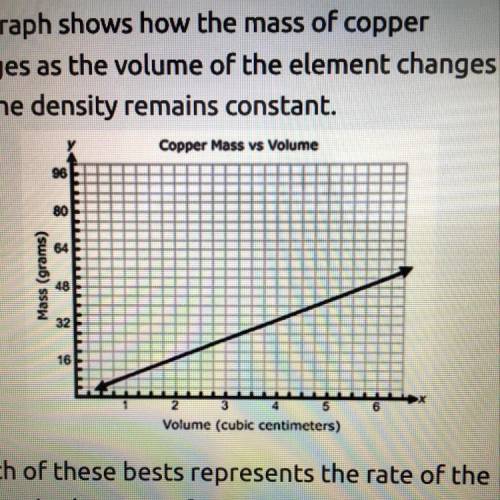
The graph shows how the mass of copper
changes as the volume of the element changes
and the d...

Mathematics, 16.10.2020 09:01 chloeholt123
The graph shows how the mass of copper
changes as the volume of the element changes
and the density remains constant.
*picture*
Which of these bests represents the rate of the
change in the mass of copper with respect to the
volume?
a.4/33 g/cm^3
b.19/41 g/cm^3
c.8 1/4 g/cm^3
d.4 4/7 g/cm^3

Answers: 3


Another question on Mathematics
Mathematics, 22.06.2019 00:30
Will mark ! (10 points also! ) if x varies inversely with y and x =6 when y= 10, find y when x=8 a. y=4.8 b. y=7.5 c. y=40/3 d. y=4/15
Answers: 1
Mathematics, 22.06.2019 01:30
What rule describes a dilation with a scale factor of 4 and the center of dilation at the origin?
Answers: 1
You know the right answer?
Questions

Social Studies, 22.12.2020 14:00
Mathematics, 22.12.2020 14:00


German, 22.12.2020 14:00
Social Studies, 22.12.2020 14:00


Arts, 22.12.2020 14:00
Mathematics, 22.12.2020 14:00
English, 22.12.2020 14:00
Mathematics, 22.12.2020 14:00
Mathematics, 22.12.2020 14:00

History, 22.12.2020 14:00
Arts, 22.12.2020 14:00
Mathematics, 22.12.2020 14:00
Mathematics, 22.12.2020 14:00
SAT, 22.12.2020 14:00

Computers and Technology, 22.12.2020 14:00


