
Mathematics, 16.10.2020 14:01 kadariusmerchan
The following data represent the high-temperature distribution for a summer month in a city for some of the last 130 years. Treat the data as a population. Complete parts (a) through (c).
Temperature Lower Limit Upper Limit Days
50-59 50 59 2
60-69 60 69 313
70-79 70 79 1419
80-89 80 89 1503
90-99 90 99 319
100-109 100 109 9
Required:
Approximate the mean and standard deviation for temperature.

Answers: 1


 Days
Days

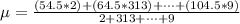
![\sigma = \sqrt{ \frac{\sum[ f_i * ( x_i^2 - \= x^2)] }{\sum f_i}}](/tpl/images/0810/8032/769d0.png)
![\sigma =\sqrt{ \frac{[2 * [(54.5)^2) - 79.7^2 ]]+[313 *[ (64.5)^2)-79.7^2] +\cdots +[9 *[ (104.5)^2)- 79.7^2] }{2 + 313 +\cdots + 9}}](/tpl/images/0810/8032/2aaa3.png)


Another question on Mathematics
Mathematics, 21.06.2019 15:40
The number of lattes sold daily for two coffee shops is shown in the table: lattes 12 52 57 33 51 15 46 45 based on the data, what is the difference between the median of the data, including the possible outlier(s) and excluding the possible outlier(s)? 48.5 23 8.4 3
Answers: 3
Mathematics, 21.06.2019 16:00
Write two subtraction equations that are equivalent to 5 + 12 = 17.
Answers: 3
Mathematics, 21.06.2019 17:00
The perimeter of a movie screen is 54 meters. the screen is 18 meters wide. how tall is it?
Answers: 1
Mathematics, 21.06.2019 20:30
Adecibel is a logarithmic unit that can be used to measure the intensity of a sound. the function y = 10logx gives the intensity of a sound in decibels, where x is the ratio of the intensity of the sound to a reference intensity. the reference intensity is generally set at the threshold of hearing. use the graphing utility to graph the decibel function.a whisper has a sound intensity of 30 decibels. use your graph to you complete the following statement. the sound intensity of a whisper is times the reference intensity.
Answers: 1
You know the right answer?
The following data represent the high-temperature distribution for a summer month in a city for some...
Questions

History, 24.03.2020 01:36
Mathematics, 24.03.2020 01:36

Geography, 24.03.2020 01:36


Social Studies, 24.03.2020 01:36
Mathematics, 24.03.2020 01:36

Physics, 24.03.2020 01:36
Mathematics, 24.03.2020 01:36
Mathematics, 24.03.2020 01:36

Biology, 24.03.2020 01:36
Mathematics, 24.03.2020 01:36


