HELP
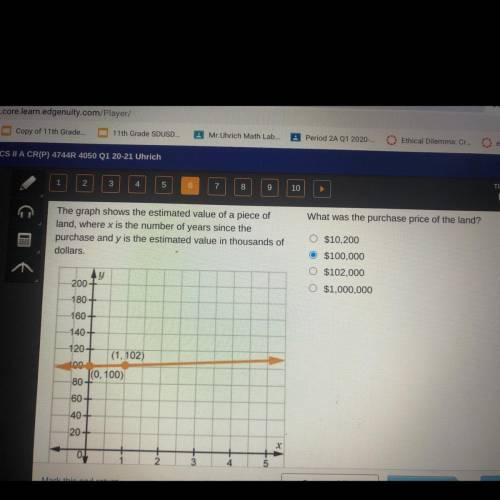
The graph shows the estimated value of a piece of
land, where x is the number of years s...

Mathematics, 16.10.2020 22:01 microwave13016
HELP
The graph shows the estimated value of a piece of
land, where x is the number of years since the
purchase and y is the estimated value in thousands of
dollars.


Answers: 3


Another question on Mathematics

Mathematics, 21.06.2019 14:00
Question 1(multiple choice worth 1 points)(07.06 mc)a group of students must collect at least $150 to organize a science fair. they have already collected $30. which graph best represents all remaining amounts of money, in dollars, that thestudents should still collect to organize the science fair? -210 -180 -150 - 120 -90-60 -300306090 120 150 180 210-210 -180 -150 - 120 -90 -60 -30 0 30 60 90 120 150 180 210-210 -180-150 - 120 -90-60-300 30 60 90 120 150 180 210-210 -180 -150 - 120.90 -60 -30 0 30 60 90 120 150 180 210
Answers: 3


Mathematics, 21.06.2019 16:50
Which three lengths could be the lengths of the sides of a triangle? 21 cm, 7 cm, 7 cm 9 cm, 15 cm, 22 cm 13 cm, 5 cm, 18 cm 8 cm, 23 cm, 11 cm
Answers: 2
You know the right answer?
Questions


Mathematics, 07.04.2020 03:29


Mathematics, 07.04.2020 03:29

Spanish, 07.04.2020 03:29


Mathematics, 07.04.2020 03:29


