The graph shows the distance of
a remote control drone above the
ground as it flies west to e...

Mathematics, 18.10.2020 07:01 Haven263
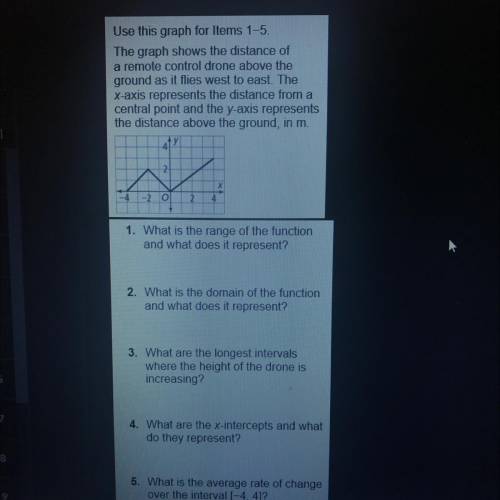
The graph shows the distance of
a remote control drone above the
ground as it flies west to east. The
X-axis represents the distance from a
central point and the y-axis represents
the distance above the ground, in m.

Answers: 2


Another question on Mathematics
Mathematics, 21.06.2019 19:00
Find the length of the diagonal of the rectangle. round your answer to the nearest tenth. || | | 8 m | | | | 11 m
Answers: 2
Mathematics, 21.06.2019 19:30
Each cookie sells for $0.50 sam spent $90 on baking supplies and each cookie cost $0.25 to make how many cookies does sam need to sell before making a profit formula: sales> cost
Answers: 1
Mathematics, 21.06.2019 23:30
Astudent must have an average on five test that is greater than it equal to 80% but less than 90% to receive a final grade of b. devon's greades on the first four test were 78% 62% 91% and 80% what range if grades on the fifth test would give him a b in the course? ( assuming the highest grade is 100%)
Answers: 1
You know the right answer?
Questions


Computers and Technology, 28.02.2020 23:10
Mathematics, 28.02.2020 23:10
Mathematics, 28.02.2020 23:10

History, 28.02.2020 23:10


Mathematics, 28.02.2020 23:10

Social Studies, 28.02.2020 23:10
History, 28.02.2020 23:10


