
Mathematics, 19.10.2020 09:01 evarod
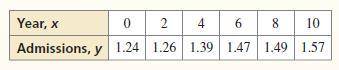
The table shows the total number y (in billions) of U. S. movie admissions each year for x years. Use a graphing calculator to find an equation of the line of best fit for the data. Round each value to the nearest hundredth.
The line of best fit is y = _
(I need this by 11 pm please)

Answers: 3
 Admission, y

Another question on Mathematics
Mathematics, 21.06.2019 19:00
If f(x)= sqrt4x+9+2, which inequality can be used to find the domain of f(x)?
Answers: 2
Mathematics, 21.06.2019 19:00
Lucy is a dress maker. she sews \dfrac47 7 4 of a dress in \dfrac34 4 3 hour. lucy sews at a constant rate. at this rate, how many dresses does lucy sew in one hour? include fractions of dresses if applicable
Answers: 3
Mathematics, 21.06.2019 20:30
Daryl factors the polynomial p(x)=x3+x2−26x+24 to rewrite it as p(x)=(x+6)(x−4)(x−1). which equations must be true? there may be more than one correct answer. select all correct answers. p(1)=0 p(−4)=0 p(−1)=0 p(6)=0 p(4)=0 p(−6)=0
Answers: 1
You know the right answer?
The table shows the total number y (in billions) of U. S. movie admissions each year for x years. Us...
Questions

Mathematics, 20.03.2020 21:25

Chemistry, 20.03.2020 21:25


Mathematics, 20.03.2020 21:25


History, 20.03.2020 21:27
Mathematics, 20.03.2020 21:27


