
Mathematics, 19.10.2020 18:01 vivianni0727p1y30v
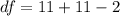
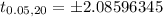
A researcher wants to compare the heights of males between generations to see if they differ. To do this, he samples random pairs of males who are at least 18 years old and their fathers. He then splits them into a sample of fathers and a sample of sons. Suppose that data were collected for a random sample of 11 pairs, where each difference is calculated by subtracting the height of the son from the height of the father. Assume that the heights are normally distributed. The test statistic is t≈1.971, α=0.05, the corresponding rejection regions are t<−2.228 and t>2.228, the null hypothesis is H0:μd=0, and the alternative hypothesis is Ha:μd≠0.
Select all that apply:
a. Reject the null hypothesis.
b. Fail to reject the null hypothesis.
c. The conclusion of the hypothesis test is that there is sufficient evidence to suggest that the heights of males between generations are different.
d. The conclusion of the hypothesis test is that there is insufficient evidence to suggest that the heights of males between generations are different.

Answers: 1


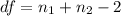
 is the sample size of father which is
 is the sample size of males who are at least 18 years old which is


Another question on Mathematics
Mathematics, 21.06.2019 16:30
You are making a battery for a science project. you have copper wire for your first electrode. you need to choose a conductor, a second electrode, and a device to plug into your battery. you have already chosen a lemon conductor. complete each statement below about the options that include a lemon conductor.
Answers: 2
Mathematics, 21.06.2019 22:00
Which is the correct first step in finding the area of the base of a cylinder with a volume of 26x cubic meters and a height of 6.5 meters? v=bh 6.5=b(26x) v=bh v=26pi+(6.5) v=bh v=26pi(6.5) v=bh 26pi=b(6.5)
Answers: 1
Mathematics, 22.06.2019 02:00
The poll report includes a table titled, “americans using cash now versus five years ago, by age.” the age intervals are not equal. why do you think the gallup organization chose the age intervals of 23–34, 35–54, and 55+ to display these results?
Answers: 3
Mathematics, 22.06.2019 03:00
Describe how the presence of possible outliers might be identified on the following. (a) histograms gap between the first bar and the rest of bars or between the last bar and the rest of bars large group of bars to the left or right of a gap higher center bar than surrounding bars gap around the center of the histogram higher far left or right bar than surrounding bars (b) dotplots large gap around the center of the data large gap between data on the far left side or the far right side and the rest of the data large groups of data to the left or right of a gap large group of data in the center of the dotplot large group of data on the left or right of the dotplot (c) stem-and-leaf displays several empty stems in the center of the stem-and-leaf display large group of data in stems on one of the far sides of the stem-and-leaf display large group of data near a gap several empty stems after stem including the lowest values or before stem including the highest values large group of data in the center stems (d) box-and-whisker plots data within the fences placed at q1 â’ 1.5(iqr) and at q3 + 1.5(iqr) data beyond the fences placed at q1 â’ 2(iqr) and at q3 + 2(iqr) data within the fences placed at q1 â’ 2(iqr) and at q3 + 2(iqr) data beyond the fences placed at q1 â’ 1.5(iqr) and at q3 + 1.5(iqr) data beyond the fences placed at q1 â’ 1(iqr) and at q3 + 1(iqr)
Answers: 1
You know the right answer?
A researcher wants to compare the heights of males between generations to see if they differ. To do...
Questions
Mathematics, 21.02.2021 14:00
Mathematics, 21.02.2021 14:00
Mathematics, 21.02.2021 14:00


World Languages, 21.02.2021 14:00
Mathematics, 21.02.2021 14:00


History, 21.02.2021 14:00
Mathematics, 21.02.2021 14:00
Mathematics, 21.02.2021 14:00
Mathematics, 21.02.2021 14:00
English, 21.02.2021 14:00


Physics, 21.02.2021 14:00


